Written by Matthew Gutierrez


Portfolio Loan Rates in 2026: Securities-Backed vs Property-Backed
Portfolio Loan Rates in 2026: Securities-Backed vs Property-Backed
Securities-backed lines, DSCR loans and margin borrowing price very differently in late 2026. Current rates by collateral type, each verified at source.
Matthew Gutierrez
Portfolio loan rates in late 2026 run roughly 4.6% to 8.3%, and the spread is driven by collateral type and loan size rather than borrower quality. Securities-backed borrowing prices lowest because the collateral is liquid: margin loans start near 4.63% and pledged asset lines run 6.25% to 8.25% before relationship discounts. Property-backed DSCR and non-qualified mortgage loans run 6.25% to 7.875%. For comparison, the 30-year conventional mortgage averaged 7.03% in the week of September 24, 2026, so the cheapest portfolio borrowing now prices below a conventional mortgage.
Key Takeaways
- Portfolio loan rates run roughly 4.6% to 8.3% in late September 2026, set mainly by collateral type and loan size.
- Securities-backed borrowing is the cheapest form, and several versions of it now price below the 7.03% conventional 30-year mortgage.
- On a pledged asset line, size moves the rate two full percentage points, and relationship discounts move it up to another one.
- DSCR and non-qualified mortgage pricing has fallen to roughly 6.25% to 7.9%, well below the 8% to 9% quoted a year ago.
- Among high-net-worth borrowers, 37% use a pledged asset line or similar, and the most common purpose is buying a home, not leveraging the portfolio.
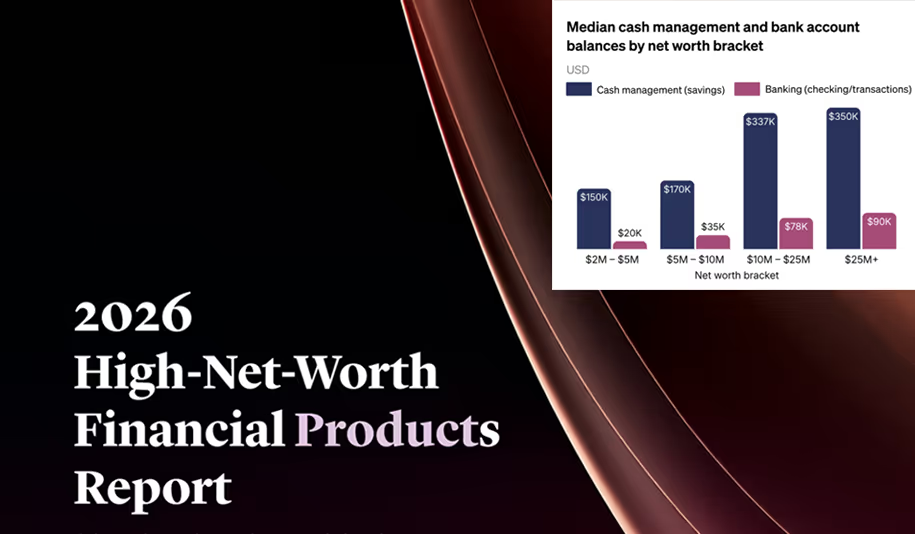
2026 High-Net-Worth Financial Products Report
See which banks, credit cards, brokerages, lenders and insurers high-net-worth households actually use and which they recommend. Based on insights from 165 investors, entrepreneurs and executives.

What Portfolio Loan Rates Look Like in Late 2026
Portfolio loan rates run from roughly 4.6% to 8.3% in late September 2026, and collateral type explains more of that spread than borrower quality does. A loan secured by a liquid securities portfolio prices lower than one secured by rental property, because the lender can sell the collateral in a day rather than a quarter.
| Loan type | Collateral | Rate, late September 2026 |
|---|---|---|
| Margin loan, balance over $1M | Securities | 4.63% |
| Pledged asset line, $2.5M and above | Securities | 6.25% |
| Pledged asset line, $500K to $1M | Securities | 7.25% |
| Pledged asset line, $100K to $250K | Securities | 8.25% |
| DSCR rental loan, 740+ FICO at 75% LTV | Property | 6.25% |
| DSCR rental loan, 640 FICO at 75% LTV | Property | 7.875% |
| Bank statement or asset depletion loan | Property | 6.375% |
| Conventional 30-year fixed, for comparison | Property | 7.03% |
Source: Interactive Brokers published margin matrix (IBKR Pro, USD); Charles Schwab Pledged Asset Line rate sheet, SOFR as of September 21, 2026; Defy Mortgage published rate matrix, updated September 21, 2026; Freddie Mac Primary Mortgage Market Survey, week of September 24, 2026. Pledged asset line rates are shown before Investor Advantage Pricing discounts.
The comparison worth sitting with is the last row. A conventional 30-year mortgage averaged 7.03% in the week of September 24, 2026. Several forms of portfolio borrowing now price below that. This reverses the usual framing, which treats high-net-worth lending as the expensive option you accept when you cannot qualify for an agency loan.
That framing was right when agency rates sat in the 3% range. It is no longer right. Conventional pricing has risen to meet the alternatives, and for a borrower with liquid collateral the alternatives are now cheaper.
Securities-Backed Lines Price Below Property-Backed Loans
Borrowing against a securities portfolio is the lowest-cost portfolio lending available to most high-net-worth households, and the rate falls as the line gets larger.
Two instruments dominate. A margin loan sits inside a brokerage account and prices off the broker's published matrix. A pledged asset line is a separate credit facility secured by a pledged account, with its own documentation and no ability to trade the collateral freely. Margin is cheaper; a pledged asset line is more stable, because the lender is not marking you to a maintenance requirement set for trading.
Schwab publishes its pledged asset line pricing openly, which makes it a useful reference point for what a large bank charges.
| Loan value at origination | Spread over SOFR | APR |
|---|---|---|
| $100,000 to under $250,000 | SOFR + 4.40% | 8.25% |
| $250,000 to under $500,000 | SOFR + 3.90% | 7.75% |
| $500,000 to under $1,000,000 | SOFR + 3.40% | 7.25% |
| $1,000,000 to under $2,500,000 | SOFR + 2.90% | 6.75% |
| $2,500,000 and above | SOFR + 2.40% | 6.25% |
Source: Charles Schwab published Pledged Asset Line rate sheet, SOFR as of September 21, 2026. SOFR was 3.90% on September 25, 2026 (Federal Reserve Bank of New York). Rates shown before Investor Advantage Pricing discounts of 0.25% to 1.00%.
Two things in that table matter more than the headline numbers. First, the spread compresses by a full two percentage points from the smallest tier to the largest, so the size of the line changes the price more than anything about the borrower. Second, the rates above are before relationship discounts. Schwab reduces the rate by 0.25% at $250,000 in qualifying assets and by 1.00% at $10 million, so a household with $10 million at the firm drawing a $2.5 million line pays 5.25% rather than 6.25%.
Margin pricing goes lower still. Interactive Brokers publishes 4.63% on balances above $1 million for its Pro tier, roughly 0.75% over its benchmark. The tradeoff is that margin collateral is subject to maintenance requirements that can force a sale in a falling market, which is the risk a pledged asset line partly buys out.
DSCR and Non-QM Rates for Rental Property
Property-backed portfolio loans run roughly 6.25% to 7.9% in late September 2026, with credit score and loan-to-value setting the position within that band.
A DSCR loan qualifies on the property's cash flow rather than the borrower's income, which is why it suits investors whose tax returns understate their capacity, the same mismatch behind most high-net-worth mortgage applications. Published pricing from one lender that originates its own loans puts a 740-plus borrower at 75% loan-to-value at 6.25%, and a 640 borrower at the same leverage at 7.875%. Bank statement, profit-and-loss and asset depletion programs price close together at about 6.375% for a 740 borrower at 75% leverage.
This is a meaningful correction to what the market was quoting a year ago, when comparable programs sat closer to 8% and 9%. A borrower who priced a rental refinance in 2025 and set the idea aside should price it again.
Fix-and-flip and bridge pricing remains well above these levels, because the terms are short and the exit is the repayment. Those loans are quoted per project rather than off a published sheet, so treat any range you see as indicative.
Why Two Borrowers Get Different Rates on the Same Collateral
Five variables move a portfolio loan quote, and only two of them are about creditworthiness.
- Loan size. On securities-backed lines this is the largest single factor. Two percentage points separate a $150,000 line from a $2.5 million one at the same institution.
- Assets held at the lender. Relationship pricing is where the largest discounts sit, and it is rarely quoted until you ask.
- Loan-to-value. Lower leverage prices lower on property loans, and determines how much cushion you have before a maintenance call on securities.
- Credit score. On DSCR loans the gap between 640 and 740 is over 1.6 percentage points. On securities-backed lines it barely registers, because the collateral is doing the work.
- Rate structure. Securities-backed lines are variable and reprice with the index, and many are interest-only, like a high-net-worth interest-only mortgage. Property loans are usually fixed for a term. In a falling-rate environment the variable line benefits automatically and the fixed loan requires a refinance.
The practical consequence is that the same household can be quoted 8.25% and 5.25% by the same bank in the same week, depending on line size and what else it custodies there.
What High-Net-Worth Households Borrow Against, and Why
Among high-net-worth households that have borrowed, securities-backed lines are the most common instrument, used by 37% of borrowers. Long Angle's research on how high-net-worth investors borrow against their portfolios covers the full picture.
| Instrument | Share of borrowers |
|---|---|
| Pledged asset line, portfolio line of credit or SBLOC | 37% |
| Margin loan | 35% |
| Home equity line of credit | 32% |
| Personal loan | 12% |
| Other | 9% |
| Box spreads | 3% |
Source: Long Angle 2026 High-Net-Worth Financial Products Report, 165 respondents, 81% with net worth over $5M, fielded July 2026. US respondents only. Shares are of respondents who have taken a loan or line of credit. Multiple response, so shares do not total 100%.
The instruments overlap heavily. Respondents could report more than one, and most draw from a set rather than choosing between alternatives. Margin loans at 35% sit close behind pledged asset lines, and a third of borrowers also hold a home equity line.
What the money is for cuts against the way these products are usually marketed. Home purchase leads at 29% and other large purchases at 28%. Portfolio leverage, the use case the industry emphasizes, sits third at 26%. Tax payments reach 20% and capital calls 15%, and both are dated obligations that arrive before the liquidity to meet them, which is why borrowing shows up so often in liquidity event planning.
Loan size tracks available collateral. The median line runs $50,000 at $2 million to $5 million of net worth and $600,000 above $25 million.
Published rate sheets also understate what is available at the edges. A member of the Long Angle community who had been declined by two large national banks reported closing a pledged asset line at 4.64% through smaller specialist providers, as of March 2026. That was a point-in-time rate under a different index level and is not a quote available today, but it illustrates the gap between posted pricing at large institutions and what a determined borrower can find.
How to Compare Portfolio Loan Offers
Compare the spread over the index rather than the headline APR, because the index moves and the spread is the part you negotiated.
Collect quotes from at least three institutions, and include at least one outside the category you started in. A borrower shopping DSCR loans for a rental refinance often has enough liquid collateral to make a securities-backed line the cheaper answer, and no DSCR lender will point that out.
Then work through the terms that are not the rate:
- Call provisions. A pledged asset line is typically demand debt. The lender can require repayment, and the moment it does so is likely to be the moment markets are down.
- Maintenance requirements. Establish how far the collateral can fall before you are asked for more, and model it against a 30% drawdown rather than a 10% one.
- Prepayment and balloon terms. On property loans, a balloon inside five years without a clear exit is the structure that causes the most trouble.
- Relationship conditions. Discounts tied to assets held at the lender can reverse if you move the assets.
Ask each lender what the rate would be one tier up in line size. The answer is often close enough that borrowing slightly more, and leaving it undrawn, costs less than borrowing what you first asked for.
Final Thoughts
Price the loan against the index, not the headline. Ask what happens if the collateral falls by a third rather than a tenth, and confirm whether the quote assumes assets you have not yet moved to the lender. The cheapest quote and the one you can live through a drawdown with are not always the same loan.
Frequently Asked Questions
What is a good interest rate on a portfolio loan?
In late September 2026, a good rate depends on collateral. On a securities-backed line of $1 million or more, anything at or below about 6.25% is competitive, and margin pricing near 4.63% is available at some brokers. On a property-backed DSCR loan, 6.25% to 6.75% is strong for a borrower above 740 FICO at 75% loan-to-value.
What are current interest rates for loans against securities?
Published pledged asset line rates ran 6.25% to 8.25% in late September 2026 depending on line size, quoted as SOFR plus a spread of 2.40% to 4.40%. Margin loans priced lower, with one large broker publishing 4.63% on balances above $1 million. Relationship discounts of 0.25% to 1.00% apply at some institutions.
Are portfolio loan rates higher than conventional mortgage rates?
No longer, in every case. The 30-year conventional fixed mortgage averaged 7.03% in the week of September 24, 2026, while a large pledged asset line priced at 6.25% and a margin loan at 4.63%. Property-backed portfolio loans remain close to or slightly above conventional pricing.
How does loan size affect a pledged asset line rate?
Substantially, and more than borrower credit does. One large bank's published schedule charges SOFR plus 4.40% on lines from $100,000 to $250,000 and SOFR plus 2.40% at $2.5 million and above, a difference of two percentage points on the same collateral and the same borrower.
What credit score do you need for the best portfolio loan rates?
On property-backed loans, 740 or above. One lender's published matrix prices a 740-plus borrower at 6.25% and a 640 borrower at 7.875% at the same 75% loan-to-value. On securities-backed lines, credit score has little effect, because pricing follows the collateral and the size of the line.
What do high-net-worth households use portfolio loans for?
Mostly ordinary purchases rather than investment leverage. In the Long Angle 2026 High-Net-Worth Financial Products Report, home purchase led at 29% of borrowers and other large purchases at 28%, ahead of portfolio leverage at 26%. Tax payments reached 20% and capital calls 15%. Based on 165 respondents, fielded July 2026.
A quote sounds fair until you see what three other members were offered.
Long Angle is a vetted community of high-net-worth entrepreneurs, executives and investors who compare notes on lending, tax and investment decisions before they commit, with the numbers attached.
More From Long Angle
Beyond Wealth Newsletter
Navigating Wealth Podcast
Research & Studies
Alternative Investment Education
Blog