Written by Chris Bendtsen

High-Net-Worth Financial Products: 2026 Benchmark Report
High-Net-Worth Financial Products: 2026 Benchmark Report
A 2026 survey of 165 Long Angle members shows the banks, brokerages, cards and insurers high-net-worth households use and rate highest and lowest.
Chris Bendtsen
Benchmark Study
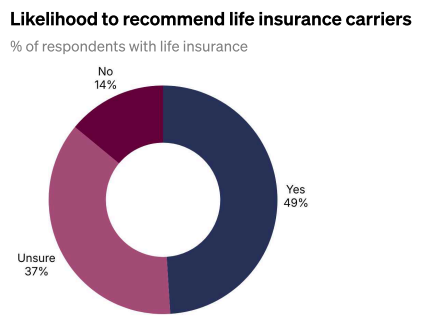
Life insurance drew the lowest satisfaction of any category in Long Angle's 2026 High-Net-Worth Financial Products Report: just 49% of holders would recommend their carrier, 37% were unsure and 14% would not. Term life dominates at 85% of holders against 14% with whole life, and median coverage rises from $1.8 million in the $2M-$5M net worth bracket to $4.4 million above $25M. Findings are based on 165 Long Angle member respondents surveyed in July 2026, a voluntary, self-selected sample of one community rather than a representative sample of high-net-worth households generally.
Key Takeaways
- Amex Platinum and Chase Sapphire Reserve have the highest credit card market share, but aren't the most recommended. While 82% and 70% of HNW cardholders recommend them, respectively, several other cards outperform on customer advocacy. These include BofA Premium Rewards Elite (100% recommend), Capital One Venture X (92%), and even the Amazon Prime Visa (90%).
- Fidelity and Schwab beat the banks at banking, earning near-unanimous approval across cash management (91% and 88% of users recommend, respectively), banking (93% and 90%), and lending (86% and 91%). Chase, Bank of America, and Wells Fargo earned lower marks across every product line.
- Rocket Mortgage leads a weak field of mortgage lenders: 67% recommend it, compared to Chase (43%), Wells Fargo (40%), and Bank of America (25%).
- HNW specialty insurers are the gold standard. Cincinnati and PURE are far more recommended than mass-market carriers like State Farm. For home insurance, 88% recommend Cincinnati; 100% recommend PURE (on a smaller base). For umbrella insurance: 78% Cincinnati, 83% PURE.
- Life insurance drew the most regret of any category. Only 49% of policyholders would recommend their carrier, and 37% were unsure. Northwestern Mutual, the most common carrier among respondents, has the lowest recommend rate at 20%, though on a small base.
- All figures reflect 165 self-selected high-net-worth respondents.

What the 2026 Financial Products Study Covers
The report is Long Angle's inaugural benchmark of the financial and insurance products high-net-worth households use, fielded in July 2026 among 165 Long Angle members. It spans credit cards, banking, cash management, brokerage, portfolio and budget tracking, lending, mortgage, and six insurance categories. Respondents named their providers, said whether they would recommend each one to a peer, and answered category-specific questions such as loan purpose, coverage amount, and card usage reason. The recommend rate is the study's core metric: the share of a provider's users who would recommend it.
The sample skews wealthy, working-age and domestic. 81% reported over $5M in net worth, 75% were under 55, and 92% were US-based. That profile makes the findings a useful read on active, self-managing high-net-worth investors.
The Most-Used Credit Cards Aren't the Most Recommended
Adoption and advocacy diverge among credit cards. Amex Platinum (31% use) and Chase Sapphire Reserve (30% use) led on adoption but drew 82% and 70% recommend rates, behind Capital One Venture X, BofA Premium Rewards Elite, and cash back cards like the Amazon Prime Visa. Several Platinum and Sapphire Reserve holders described rewards eroding toward coupon-book credits.
Select travel credit cards: HNW usage and % who recommend
Source: Long Angle, 2026 High-Net-Worth Financial Products Report
Select cash back credit cards: HNW usage and % who recommend
Source: Long Angle, 2026 High-Net-Worth Financial Products Report
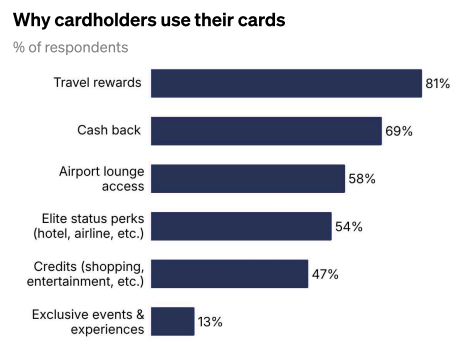
What cardholders optimize for is simpler than what card issuer marketing implies. Travel rewards (81%) and cash back (69%) were the top reasons to hold a card. Airport lounge access (58%) and elite status perks (54%) followed, and shopping and entertainment statement credits (47%) ranked lower despite heavy issuer emphasis in advertising. Respondents who did chase statement credits described the effort to earn, track, and redeem them as a frustration.
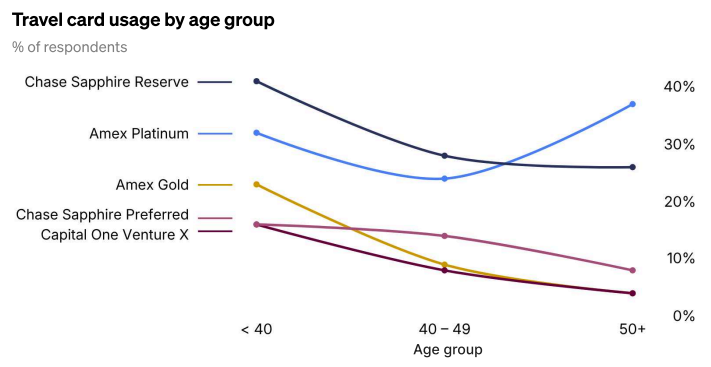
Looking at the most-used credit cards by age, Chase Sapphire Reserve skewed younger while Amex Platinum dominated the 50+ group, some of whom have held it for decades. Amex Platinum users also reported the highest median monthly spend among travel cards at roughly $8K, which is consistent with a long-tenured, higher-spending base.
Brokerages Are More Recommended Than Banks, Even for Banking
Respondents recommend the brokerages they use far more than banks, including for banking products. Fidelity and Schwab drew 91% and 88% recommend rates for cash management (saving/storing cash), and 93% and 90% for checking/transactional banking. Chase, Bank of America, and Wells Fargo trailed across both products.
Cash management and banking products: % who recommend
Source: Long Angle, 2026 High-Net-Worth Financial Products Report
Big banks still hold the most banking (checking / transactional) relationships by share of users, but they hold them on convenience rather than advocacy. Respondents described legacy checking accounts as something they keep rather than endorse. The two features they valued most in a banking or cash account were a high interest rate (68%) and consolidation with a brokerage (62%), which are the two areas where brokerage cash accounts have an edge. Branches still mattered to 61%, which helps explain why lower-rated banks retain users.
For cash management and banking, cash balances rise significantly beyond $10M in net worth. After the $10M threshold, the median amount that respondents have in cash management accounts reaches over $300K, and in transactional bank accounts over $75K.
Median cash balances by net worth bracket
Source: Long Angle 2026 High-Net-Worth Financial Products Report, n=165.
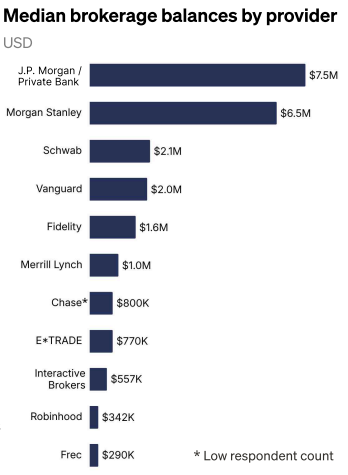
For brokerage accounts, provider mix and account size shift across wealth tiers. The largest brokerage balances are concentrated at private-bank and wirehouse relationships: J.P. Morgan / Private Bank ($7.5M median brokerage balance) and Morgan Stanley ($6.5M) sat far above Schwab ($2.1M), Vanguard ($2.0M) and Fidelity ($1.6M).
Portfolio-Backed Credit Lines Are the Default Borrowing Tool
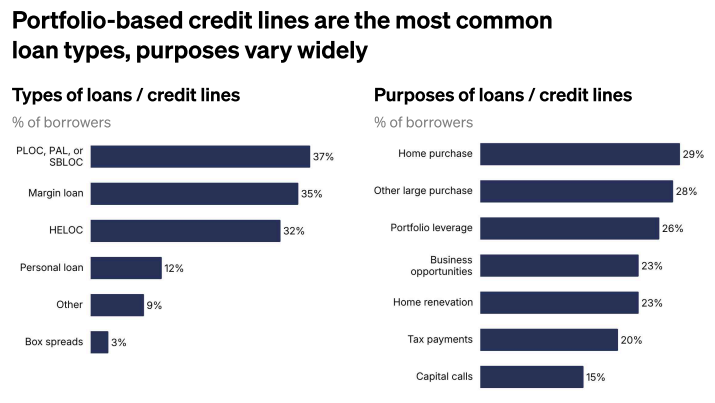
High-net-worth borrowers treat their portfolios as a general-purpose liquidity source. Portfolio-based credit lines (PLOC, PAL or SBLOC) were the most common loan type at 37%, followed by margin loans (35%) and HELOCs (32%). Loan purposes ranged widely: home purchase (29%), other large purchases (28%), portfolio leverage (26%), business opportunities (23%), home renovation (23%), tax payments (20%) and capital calls (15%).
Lending recommend rates concentrate at a few providers. Schwab (91%) and Fidelity (86%) led among providers with meaningful respondent counts. J.P. Morgan / Private Bank posted a 100% recommend rate, though on a low respondent base. Two brokerage borrowers described their rates as noncompetitive, and one respondent's advice was to shop lenders.
Loan size scales with available collateral: larger portfolios and more home equity support larger lines. Respondents described drawing on lines for short-term cash and repaying once other liquidity, such as a stock sale, arrives.
Median loan or credit line amount by net worth bracket
Source: Long Angle, 2026 High-Net-Worth Financial Products Report
Mortgage Lenders Have Poor Customer Advocacy
Mortgages earned the lowest recommend rate of any financial category at 54% of holders, and no lender stood out on advocacy at scale. Rocket Mortgage (67% recommend) led the named lenders, ahead of all the big banks: Chase (43%), Wells Fargo (40%) and Bank of America (25%). A recurring frustration was mortgages being sold to a new servicer without the borrower's input, which likely depresses satisfaction independent of the originator.
Over half (57%) have a 30-year fixed mortgage, but 30% have an adjustable-rate mortgage. That’s a sizable share that made a deliberate rate for risk trade-off rather than defaulting to the standard product. Separately, 47% of respondents with a mortgage had refinanced, consistent with the record-low rate window of 2020 and 2021.
Specialty Insurers Separate From Standard Carriers on Home and Umbrella
High-net-worth specialty carriers are more recommended than standard carriers on home and umbrella coverage. For home insurance, Cincinnati (88%) and PURE (100%, low base) led, while State Farm, the most-used carrier at 19% of policy holders, drew just 43%. Respondents credited premium carriers for reliably paying claims, and one State Farm customer's advice was to go with a specialty carrier if one is available.
The gap tracks with home value. Specialty carriers insured the highest-value homes in the sample: PURE at a $2.85M median and Cincinnati and Chubb at $2.25M, against roughly $1.20M for State Farm. Standard carriers often cap coverage below what a $2M-plus home needs, which is the practical reason owners of higher-value homes move to specialty insurers.
The advantage narrows for auto. For auto insurance the recommend-rate gap between specialty and standard carriers all but disappeared, with GEICO (83%) rating well among standard carriers and PURE and Cincinnati rating lower on auto than on home. The practical implication is that home coverage, not auto, is the reason to consider a specialty carrier, with auto often following for bundling.
Home insurance recommend rates
Source: Long Angle 2026 High-Net-Worth Financial Products Report, n=165, US respondents.
* Low respondent count
Umbrella Coverage is Standard Above $5M in Net Worth
Umbrella insurance is close to standard once net worth passes $5M. Uptake rose from 48% of respondents in the $2M–$5M bracket to 75% at $5M–$10M and 83% at $10M–$25M, before leveling at 81% for $25M+. Surprisingly, that plateau means roughly 1 in 5 respondents above $25M still reported no umbrella policy.
Coverage amounts scale with wealth while shrinking as a share of it: median coverage ran from $2.5M in the lowest bracket to $8.4M at $25M+. Pricing has scale economics: median annual premiums fell from about $500 per $1M at the $1M coverage tier to roughly half that per $1M at the $10M tier. Specialty carriers offered the highest limits, with Cincinnati at a $10M median coverage, but could cost more than twice as much as standard options for the same protection.
Umbrella insurance uptake and median coverage by net worth
Source: Long Angle 2026 High-Net-Worth Financial Products Report, n=165, US respondents.
Among umbrella carriers, Cincinnati (78%), Chubb (70%) and PURE (83%) held decent recommend rates, while standard carriers were mixed. State Farm (44%) and GEICO (33%) missed on expectations, and RLI posted 100% on a small base.
Life Insurance Customers Regret Their Carriers
Life insurance was the weakest category in the study for satisfaction. Only 49% of holders would recommend their carrier, 37% were unsure and 14% would not. Northwestern Mutual, the most common carrier in the sample, had just a 20% recommend rate (on a low base), and MetLife earned 25%. Frustrations centered on slow processes, dated technology, and unhelpful agents.
Some of the dissatisfaction is with the product rather than the carrier. Term life dominated at 85% of holders, whole life at 14% and universal at 10% (holders could report more than one). Several respondents said they regretted a whole life purchase and would not repeat it, and one advised that above a certain net worth and liquidity it is a poor investment. On pricing, term life premiums typically ran below 0.1% of coverage: medians moved from $475 at $500K of coverage to $2,000 at $3M.
Coverage rises with wealth but at a shrinking ratio to net worth, from a $1.8M median in the $2M–$5M bracket to $4.4M at $25M+. Notably, median coverage barely moved between the $5M–$10M and $10M–$25M brackets despite the higher bracket being three times wider, consistent with life insurance functioning as income replacement and liquidity rather than scaling with total assets.
Methodology
The 2026 High-Net-Worth Financial Products Report is Long Angle's inaugural study of the financial and insurance products used and recommended by high-net-worth households. It was fielded in July 2026 among 165 members of Long Angle, a private, vetted community of more than 9,000 individual investors, entrepreneurs and executives.
Respondent profile: 81% reported over $5M in net worth, 75% were under 55 and 92% were US-based. Respondents were asked to name their providers across financial and insurance products, to say whether they would recommend each provider to a peer, and to answer category-specific questions. They could leave an optional comment for peers. Credit card figures exclude business cards. Banking refers to checking and transactional accounts; cash management refers to saving and storing cash. Lending, mortgage and all insurance figures are among US respondents only. The recommend rate for a provider is the share of that provider's users who would recommend it.
All figures are self-reported. Respondents were a voluntary, self-selected sample of a single private community, so the results describe this group and should not be read as representative of all high-net-worth households. Findings marked with an asterisk in the report rest on low respondent counts and are directional only.
Access the Full Report
The full 2026 High-Net-Worth Financial Products Report includes 28 pages filled with every category table, provider-level recommend rates, median balances and premiums, and the full segment breakdowns by net worth and age.
About Long Angle
Long Angle is a private, vetted community of more than 9,000 successful entrepreneurs, executives and investors, most of them self-made and between 30 and 55, with portfolios from roughly $5M to $100M. Members use it to compare notes on the financial decisions this report measures, without anyone selling to them inside the community. Apply for Membership »
Research