Music Royalties Investment Guide

Hipgnosis Songs Fund Limited
Looking for a trusted network of high-net-worth peers? Apply now to join Long Angle, a vetted community where successful investors, entrepreneurs, and professionals connect. Access confidential discussions, live events, peer advisory groups, and curated investment opportunities.
Long Angle’s Music Royalties Investment Guide introduces investors to music intellectual property (IP) royalties. The paper explains the structure of the music royalty ecosystem, the two underlying copyrights, and the core revenue streams they generate. It also breaks down the financial metrics used to evaluate music catalogs, including KPIs, valuation multiples, and examples from recent large-scale transactions.
Table of Contents
Access the Full Investment Guide Here
The Music Royalty Ecosystem
Music intellectual property (IP) royalties are emerging as a durable, long-duration asset class. Music royalties offer investors the potential for stable, uncorrelated cash flows driven by the secular growth of the global music streaming market.
The global music market reached $105 billion in 2024 and is projected to hit nearly $200 billion by 2035 (a compound annual growth rate of about 6%), providing a powerful macroeconomic tailwind for the asset class. 1
Global Music Market Revenues ($bn) and % Growth

Source: Goldman Sachs Research, IFPI Global Music Report 2025
The music royalty landscape’s foundational legal structure is a dual copyright system. Every recorded song embodies two distinct forms of intellectual property, each generating its own set of revenue streams through a complex network of rights holders and collection societies:
Composition Copyright: the song
Sound Recording Copyright: the master
The entire economic model of the music industry is built upon these two separate and distinct copyrights that are created the moment a song is written and recorded. 2
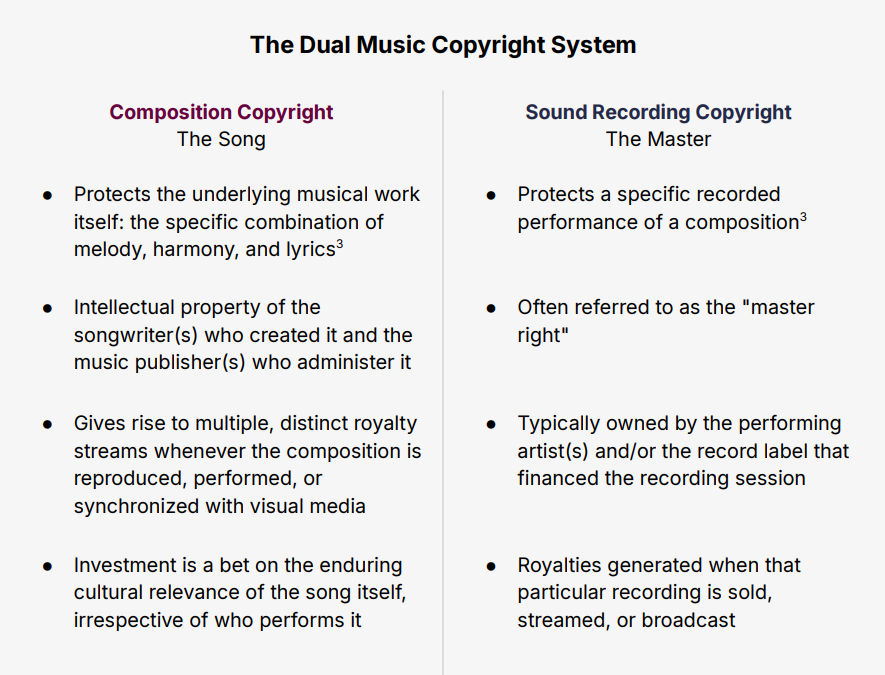
The distinction between these two copyrights is fundamental to any investment strategy. For instance, Leonard Cohen's composition "Hallelujah" has been recorded by thousands of artists. Owning a share of the composition copyright grants the holder a portion of the revenue generated from every version, creating an income stream tied to the song's timeless appeal.
Conversely, owning the master rights to Jeff Buckley's iconic 1994 recording of "Hallelujah" represents a more concentrated investment, with returns tied directly to the popularity and usage of that specific performance.
Composition rights often exhibit characteristics of a lower-volatility, annuity-like asset. Master rights offer higher potential returns but with a risk profile concentrated on a single recording.
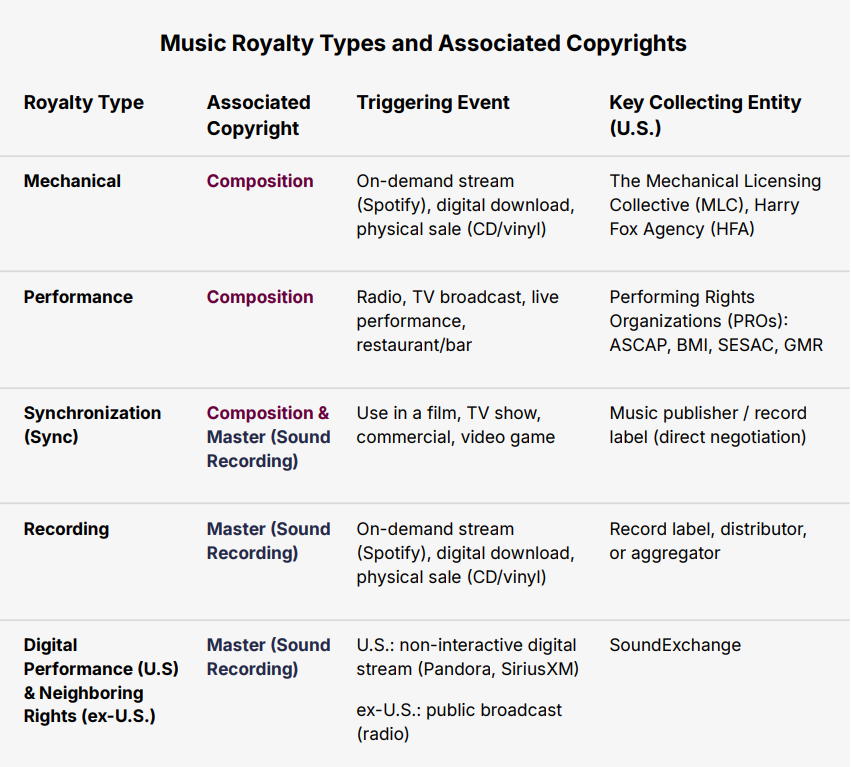
Royalty Streams: Five Core Revenue Channels
The two copyrights generate five main types of royalties, triggered by music consumption:
Mechanical
Performance
Synchronization (sync)
Recording
Digital performance / neighboring rights
The diagram below is an example from Hipgnosis Songs Fund Limited (acquired by private equity giant Blackstone in 2024) that demonstrates the income streams of core revenue channels to a royalties fund. Notice the arrows show that most of the revenue is collected through third parties.
Income Flows to Music Fund From Copyrights (March 2023)

Source: Hipgnosis Songs Fund Limited Annual Report For the Year Ended 31 March 2023
The Flow of Capital
The path that revenue travels from the end-user to the investor involves multiple intermediaries, each extracting a fee. This structure introduces both administrative costs and significant time delays into the payment cycle. Key intermediaries include:
Publishers: These entities act as the administrative backbone for composition copyrights. They are responsible for registering songs, issuing licenses for their use, monitoring for infringement, and collecting and distributing royalties to songwriters. 4
Record Labels: Labels finance, market, and distribute master recordings. They collect the revenue generated from these recordings and pay a contractually agreed-upon royalty percentage to the performing artists. 4
Performing Rights Organizations (PROs): In the U.S., ASCAP, BMI, SESAC, and the newer GMR are the primary PROs. They issue "blanket licenses" to thousands of music users (e.g., radio stations, TV networks, venues), allowing them to play any song from the PRO's vast catalog. They then track this usage and distribute the collected license fees as performance royalties to their affiliated publishers and songwriters. 5
The Mechanical Licensing Collective (The MLC): Established in the U.S. by the 2018 Music Modernization Act, the MLC is responsible for issuing and administering a blanket mechanical license to digital service providers (DSPs) like Spotify. It collects these mechanical royalties from the DSPs and distributes them to the correct publishers and songwriters, aiming to streamline a historically fragmented process. 6
SoundExchange: This non-profit organization collects and distributes digital performance royalties for master recordings from non-interactive services on behalf of record labels and performing artists. 7
These various entities create a notable "collection lag." There is often a delay of 6–12 months, and sometimes longer, from the time a song is consumed (e.g., streamed on Spotify) to the time the ultimate rights holder receives the corresponding royalty payment. 8
Financial Metrics Used to Evaluate Music Catalogs
Music royalties are ultimately a stream of cash flows, like any other asset. The intrinsic value is based on the durability and predictability of those cash flows. Once you extract away the glitz of the music, investors can take a quantitative approach to pricing these assets for target returns.
To value composition and sound recording copyrights, the industry relies on specific financial metrics that represent the net income attributable to the primary rights holder after all other parties have been paid.
NPS and NLS
Net Publisher’s Share (NPS): royalty revenue collected by a music publisher from a composition, minus royalties paid out to songwriters and any co-publishers. 9 In a typical publishing agreement, the total income from a song is split into a "Writer's Share" and a "Publisher's Share," each representing 50% of the total. 10 The NPS is a foundational metric for valuing publishing assets, with market multiples applied directly to this figure. 11
Net Label's Share (NLS): revenue received by a record label from the exploitation of its sound recordings, less the royalty payments to artists, producers, and other third parties. 12 In a typical record deal, the label recoups its expenses from the artist’s share of royalties. The remaining profit is split between the label and the artist according to their contract (often 50/50). 13 The NLS serves as the basis for valuing master recording catalogs.
NPS and NLS are typically the most important metrics for valuations and reflect high margins. Beneath NPS and NLS you typically have administration and distribution fees for the collection of royalties and modest fees (management, consulting, professional). Once these are subtracted, you arrive at an operating income metric akin to EBITDA. For highly efficient operating models, EBITDA margins can be ~80-90%.
LTM Earnings and Trend Rate
Last 12 Months' (LTM) Earnings: total gross or net revenue generated by the royalty stream in the most recent one-year period. Market-based approaches apply a multiple directly to this figure. 14 For example, a catalog that generated $10,000 in LTM earnings and sold for $50,000 traded at a 5x LTM multiple.
Trend Rate (Decay Rate): percentage change in earnings over a specified period, typically the last three years. It reveals the trajectory of the asset's income stream. 15 A positive trend rate indicates growth, while a negative rate signifies decay. A three-year average decay rate of less than -5% is generally considered a high-quality, stable catalog. 16
While a high LTM figure is attractive, it is a static snapshot that can be misleading without the context provided by the trend rate. A catalog with $100,000 in LTM earnings and a +2% trend rate represents a stable, appreciating asset. In contrast, a catalog with $120,000 in LTM earnings but a -15% trend rate is a rapidly depreciating asset, and its higher current income does not compensate for its poor trajectory. The trend rate is a more powerful predictor of future cash flows and, therefore, a more critical indicator of an asset's intrinsic value.
Royalty Decay Curve and Dollar Age
The Royalty Decay Curve: The earnings lifecycle of a song follows a predictable pattern. Income peaks within the first 3–12 months after its release, driven by initial promotion and discovery. This is followed by a period of relatively steep decline over the next few years. Finally, between years four and ten, the earnings stabilize into a long, predictable "tail" supported by a core fanbase, catalog streaming, and recurrent radio play. 17 This stabilization is why older catalogs can behave like long-duration annuities.
Dollar Age: a time-weighted measurement of a catalog's earnings stability and predictability. It is calculated by taking each song's contribution to the LTM earnings, multiplying it by that song's age (in years since release), summing these weighted values, and then dividing by the total LTM earnings of the entire catalog. 15
Dollar Age is arguably the most important metric for assessing an asset's risk profile, as it serves as a proxy for the predictability of future cash flows. A low Dollar Age (under 3 years) indicates that the bulk of the earnings come from recent hits that are still in the volatile portion of the decay curve. A high Dollar Age (over 7 years) suggests the income is derived from a mature, stable foundation. Investors pay a significant premium for this predictability, which is why catalogs with a higher Dollar Age consistently command higher valuation multiples. 18 According to a 2021 analysis by Royalty Exchange, there is a strong correlation between the average age of a catalog and the valuation multiple.
Distribution of Closing Multiples for Music Catalogs (2021)
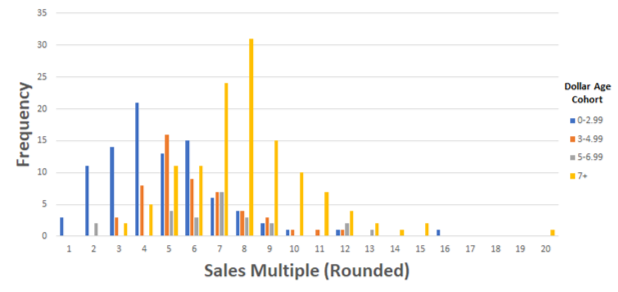
Source: Royalty Exchange, Music Multiple Mania: What Buyers Are Really Paying for Music Catalogs, And Why; April 2021
Source Diversification and Sync Revenue
Source Diversification: a well-diversified catalog generates revenue from multiple streams (mechanical, performance, sync) and platforms (Spotify, Apple Music, YouTube, radio). 19 Diversification provides resilience: a change in Spotify's royalty model or a decline in radio will have a less severe impact on a catalog that isn’t overly reliant on a single source of income. 20
Sync Revenue %: sync revenue must be treated with caution. While a strong history of sync placements is a positive indicator of a catalog's commercial appeal, these fees are typically large, one-time events that cannot be reliably projected. 21 It is critical to normalize the LTM by identifying and potentially excluding such non-recurring income spikes. Valuations should be based on more predictable and sustainable streaming and performance royalties, with syncs treated as a source of upside rather than a component of the baseline value.
The following table summarizes the key financial metrics for evaluating music royalty investments.

Qualitative Overlays
Quantitative metrics must be contextualized with qualitative factors.
Artist/Song Cultural Relevance: The ongoing career of the artist is a significant factor. An artist who is still actively touring, releasing new music, and maintaining a public profile will continue to drive interest in their back catalog. 22 Conversely, some songs achieve a timeless, "evergreen" status independent of the artist, such as perennial holiday classics or songs deeply embedded in cultural moments. 22
Social Media Traction & Virality: In the modern music ecosystem, platforms like TikTok can resurrect older songs and create massive, albeit often short-lived, spikes in streaming and royalties. 23 A catalog's potential for such viral moments, while difficult to predict, can be a source of significant upside.
Genre Stability: Different genres exhibit different decay characteristics. While contemporary pop and hip-hop may generate higher initial earnings, classic genres like rock, country, and R&B often demonstrate lower decay rates and greater long-term stability, making them attractive for investors focused on capital preservation and predictable yield.
Valuation Methodologies
Accurately valuing music IP requires combining market-relative pricing with an assessment of intrinsic value. The two methodologies are the Market Approach (using LTM or NPS multiples) and the Income Approach (Discounted Cash Flow analysis).
The Market Approach: LTM and NPS Multiples
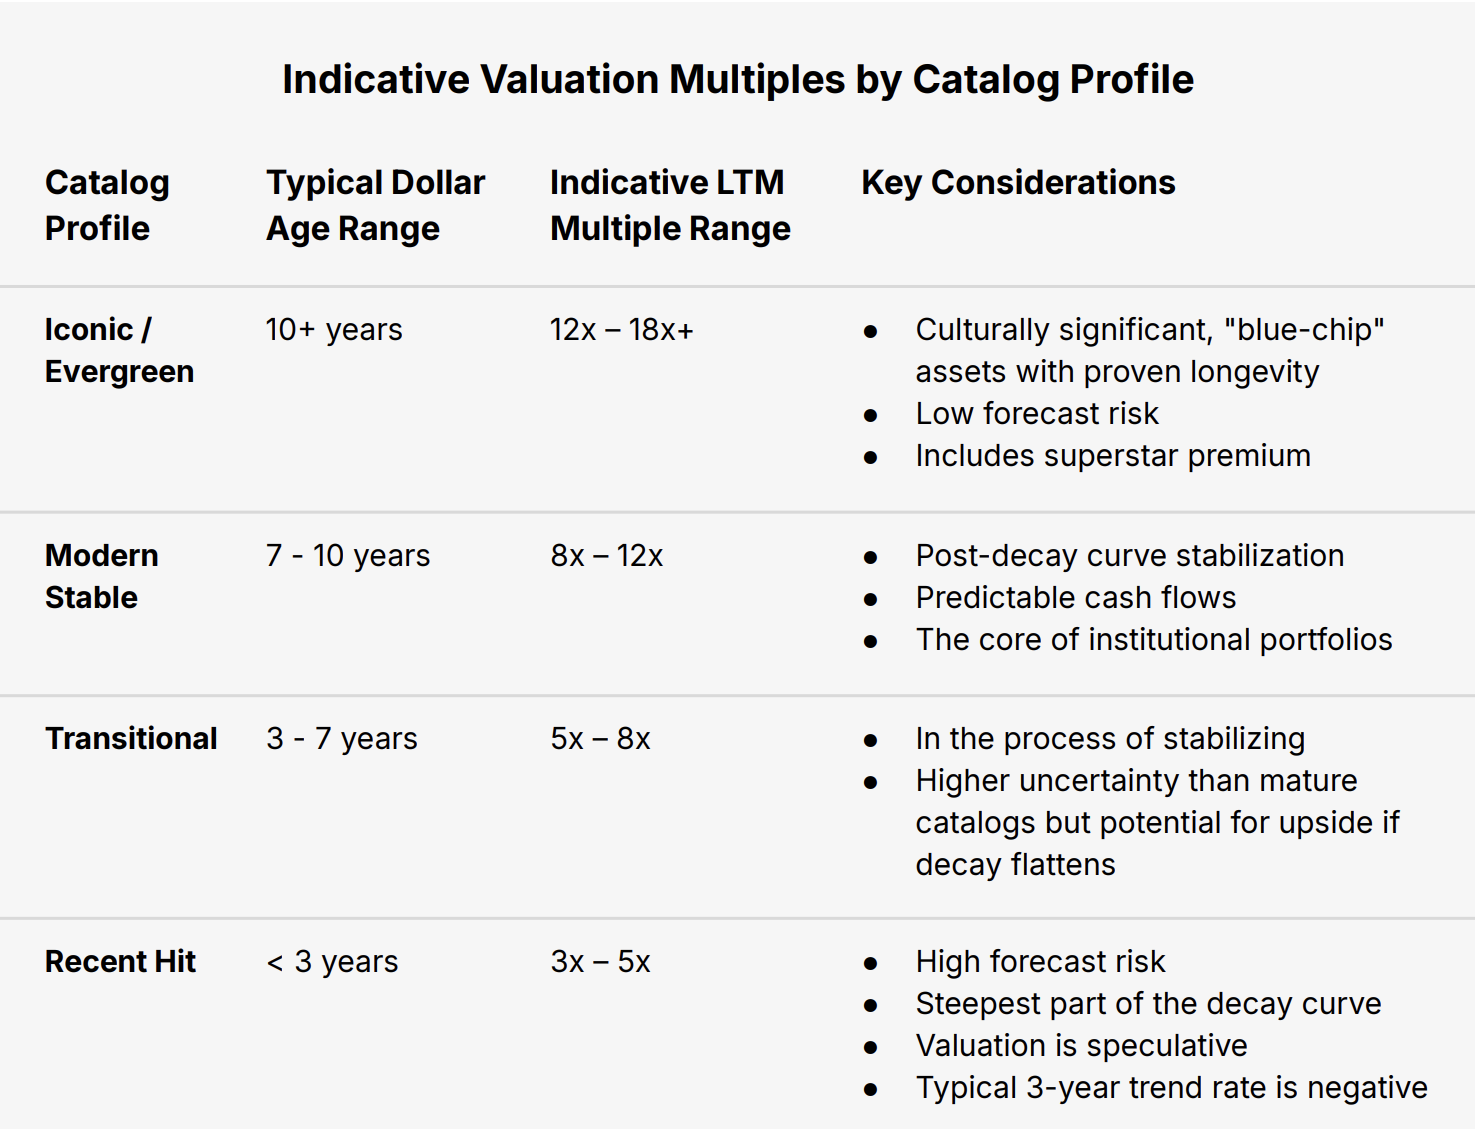
The Market Approach (the most prevalent method) determines an asset's value by comparing it to recent sales of similar assets. 24 For publishing-specific deals, valuation is often based on NPS multiples, representing the net income stream to the publishing entity being acquired. A high-quality catalog with a high Dollar Age, low decay rate, and diversified income streams will command a premium multiple, while newer, more volatile catalogs will trade at a discount. 25
Evergreen/Iconic Catalogs: mature assets, typically with a Dollar Age of over 10 years and a flat or positive trend rate. They are considered the "blue-chip" assets of the music royalty world (globally recognized artists) and trade in a range of 10x–18x LTM or NPS. 24, 25
Modern/Developing Catalogs: often 3–10 years old and may still be experiencing some earnings decay, though likely stabilizing. They trade in a range of 5x–10x LTM or NPS. 24, 25
Newer Catalogs: Dollar Age under 3 years and highly speculative, as long-term earnings potential is unproven. They trade at the lowest multiples, often 3x–5x LTM or NPS, to compensate investors for the uncertainty in their future decay curve. 25
The Income Approach: Discounted Cash Flow (DCF) Analysis
The Income Approach calculates the intrinsic value of an asset by projecting its future cash flows and discounting them back to their present value. 24 The valuation is based on the asset's fundamental earning power, independent of current market sentiment. The key inputs are:
Cash Flow Projections: future royalty streams are projected over a finite period, typically 5–10 years. Projections start with the normalized LTM earnings and apply an expected trend/decay rate. This rate should be informed by the asset's historical performance and adjusted for broader industry growth forecasts.
Discount Rate: reflects the time value of money and the specific risk associated with the asset. It is typically calculated as the sum of a risk-free rate (e.g., the yield on a 10-year U.S. Treasury bond), an equity risk premium adjusted for the asset's beta, and an illiquidity premium. A typical all-in discount rate for a stable music catalog falls between 8%–10%.
Terminal Value: value of all cash flows beyond the explicit projection period. This is often calculated using a perpetuity growth model or by applying a terminal multiple to the final year's projected cash flow.
A robust valuation process utilizes both the Market and Income approaches as a check on one another. A DCF analysis provides an intrinsic value for the asset, which can then be expressed as an "implied multiple" of its LTM earnings. Annual Report »
Case Study and Recent Mega-Deals
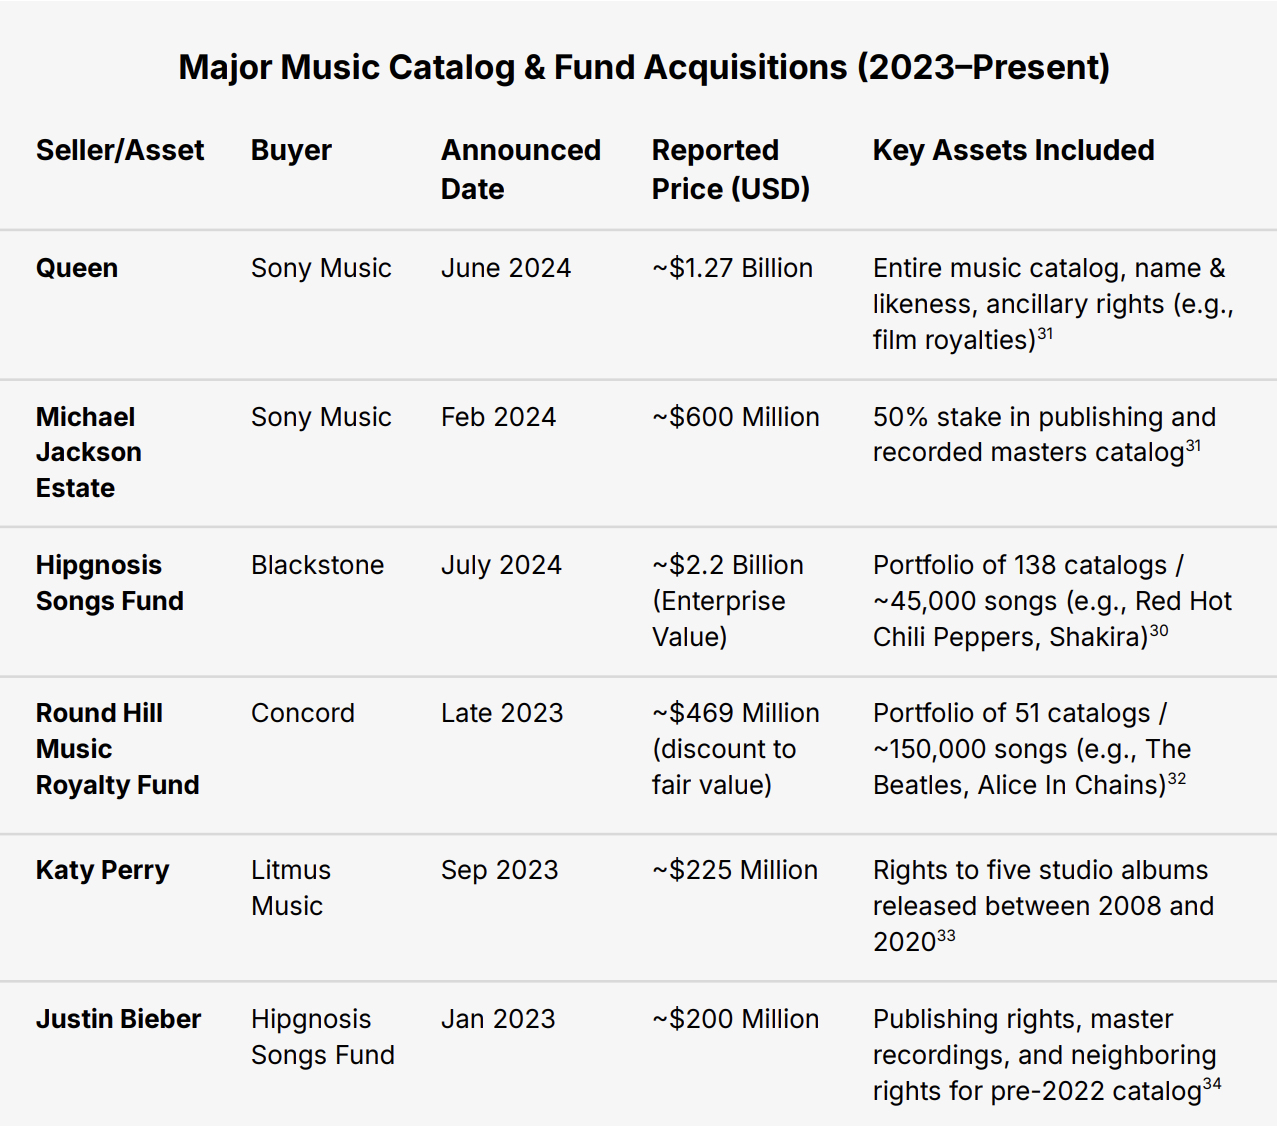
Recent years have seen blockbuster transactions for the catalogs of iconic artists, which can be attributed to a "superstar premium." These are not merely collections of songs; they are global brands with significant ancillary income potential, including biopics, merchandise, and name-and-likeness rights, which are often bundled into the sale. 26
Case Study: Blackstone Acquires Hipgnosis Songs Fund (2024)
Hipgnosis was a pioneer in establishing songs as a publicly traded asset class on the London Stock Exchange. 27 Its strategy focused on acquiring culturally significant, "proven hit songs" from iconic artists. The fund’s public listing provided transparency into catalog valuations and performance, though it traded at a significant discount to its Net Asset Value (NAV), leading to its acquisition. This transaction was a landmark moment, providing a public-to-private valuation benchmark for a large, diversified portfolio of premium music assets.
The Transaction: In July 2024, Blackstone acquired the publicly traded Hipgnosis Songs Fund (HSF) in an all-cash deal valued at around $1.58 billion. Including HSF's existing debt, the deal implied a total enterprise value of approximately $2.2 billion. 28
Valuation Analysis: For the fiscal year ending March 31, 2023, HSF reported revenues of $147.2 million. 29 While not a direct LTM figure at the time of the sale a year later, using this as a proxy suggests a revenue multiple in the neighborhood of 15x ($2.2B EV / $147.2M revenue). Following the acquisition, an independent third-party valuation firm assessed the portfolio's fair value at $2.36 billion. 30
The following table lists some of the largest mega-deals since 2023. These should be viewed as the absolute market ceiling, not direct comparables.
Long Angle members can reach out to the Long Angle Investments team with any questions on music royalties, due diligence, and opportunities to invest. Non-members can learn more about Long Angle at longangle.com and apply for membership here.
Sources
1 Goldman Sachs, Global Music Revenues Are Forecast to Double to $200 Billion in 2035
2 ICON Collective, Explained: How Music Royalties Work in the Music Industry
3 USA Songwriting Competition, 4 Types of Royalties Involved in Music Publishing
4 ICON Collective, Explained: How Music Royalties Work in the Music Industry
5 SESAC, What is a Performing Rights Organization (PRO)?
6 USA Songwriting Competition, 4 Types of Royalties Involved in Music Publishing
7 Tone, How Money Flows Through The Music Industry: Royalties 101
8 Miquido, The Future of Music Royalty Management: How Automation is Solving Payment Delays
9 ANote Music, 3 Common ways to evaluate a music catalogue – what determines the value?
10 Lawyer Drummer, The 3 Types of Music Publishing Agreements (and why they're important)
11 Royalty Exchange, Music Rights Valuation: Expert Tips and Methods 2025
12 Law Insider, Net Label Share Definition
13 Music Law Contracts, Royalties in Recording Contracts Explained
14 Royalty Exchange, 3 Stats That Prove Music Royalty Investments Can Deliver 30%+ Annualized ROI
15 Royalty Exchange, Intro to Royalties and Royalty Exchange
16 Royalty Exchange, Music Multiple Mania: What Buyers Are Really Paying for Music Catalogs, And Why
17 GLASfunds, The Case for Music Royalties
18 Royalty Exchange, Music Multiple Mania: What Buyers Are Really Paying for Music Catalogs, And Why
19 Royalty Exchange, 3 Stats That Prove Music Royalty Investments Can Deliver 30%+ Annualized ROI
20 ABF Journal, Sound Investments: The Opportunities and Risks of Music Royalties as an Asset Class
21 Royalty Exchange, Intro to Royalties and Royalty Exchange
22 Xposure Music, Revenue Forecasting for Music Catalog Investments: Tools & Strategies for Success
23 Jukebox, How to evaluate music royalties for investment
24 Royalty Exchange, Music Rights Valuation: Expert Tips and Methods 2025
25 Royalty Exchange, Music Multiple Mania: What Buyers Are Really Paying for Music Catalogs, And Why
26 Wikipedia, List of largest music deals
27 Hipgnosis Songs Fund, Hipgnosis Songs Fund Limited Annual Report 2023
28 Music Business Worldwide, The Hipgnosis Songs Fund catalog has just been valued at $2.36bn
29 Royalty Exchange, Blackstone's Hipgnosis Readies For Next Phase
30 Music Business Worldwide, The Hipgnosis Songs Fund catalog has just been valued at $2.36bn
31 Reprtoir, Music Industry Fundings: A Breakdown of 2024
32 Concord, Concord Acquires Round Hill Music Royalty Fund Adding More Than 150,000 Songs to Its Portfolio
33 Variety, Katy Perry Sells Catalog Rights to Litmus Music for $225 Million
34 Euronews, Justin Bieber sells music catalogue for $200 million: How does his deal compare to other artists?

Ready to connect with like-minded peers navigating similar wealth decisions?
Join Long Angle, a private community where successful entrepreneurs, executives, and professionals collaborate on wealth strategies, investment opportunities, and life's next chapter.