Written by Chris Bendtsen

Evergreen Fund Investment Guide
Evergreen Fund Investment Guide
Part 1 of the Evergreen Secondaries Series: Long Angle’s Evergreen Fund Investment Guide is a comprehensive introduction to private market evergreen funds.
Chris Bendtsen
Part 1 of the Evergreen Secondaries Series: Long Angle’s Evergreen Fund Investment Guide is a comprehensive introduction to private market evergreen funds. The guide defines the different types of evergreen investment vehicles, outlines key benefits for investors, and explains how to evaluate sponsors. It also clarifies common terminology and highlights performance characteristics to help readers more confidently evaluate if evergreen funds are a fit for their portfolio.
Key Takeaways
- Private evergreen fund AUM is projected to grow from $2.7 trillion in 2024 to $4.4 trillion by 2029, a pace that would take evergreens from 14% to 18% of all private capital AUM.
- Because capital deploys immediately instead of drawing down over years, Hamilton Lane found an evergreen fund needs only a 10% annualized return to reach 2.1x MOIC over eight years, versus 16% IRR for a closed-end fund targeting the same multiple.
- Redemptions are typically capped at a set percentage of NAV per quarter, and funds can gate withdrawals when requests exceed that limit. During BREIT's December 2022 gating, less than 10% of redemption requests were fulfilled, leaving roughly $200 million redeemed against a $69 billion NAV.
- Hamilton Lane's analysis of 13 equity-focused evergreen funds from 2019 to 2024 found they outperformed both public markets and closed-end private equity, though the sample size and time horizon remain limited given how recently most large evergreen funds launched.
2026 High-Net-Worth Asset Allocation Report
See how high-net-worth investors with an average net worth of $17M are allocating across public equities, private markets, real estate, bonds and cash. Based on benchmark data from 230+ respondents.

What is an Evergreen Fund?
Evergreen funds offer private market investors a perpetual investment vehicle without predetermined termination dates.
Evergreen funds exist across private equity, private credit, real estate, and other private asset classes. Unlike conventional closed-end (drawdown) private market funds that operate on fixed 8-10 year lifecycles, evergreen funds allow investors to subscribe and redeem shares on a periodic basis—typically quarterly or semi-annually.
While traditional funds require investors to make upfront capital commitments that are drawn down over years, evergreen funds deploy capital immediately upon subscription—eliminating the commitment overhang and providing instant exposure to diversified private market portfolios.
For Limited Partners (LPs—investors who contribute capital), evergreens offer:
- Full upfront capital deployment
- Semi-liquidity
For General Partners (GPs—fund sponsors who manage the investment), evergreen funds allow:
- Continuous fundraising
- Better alignment with long-term strategies (no forced exits)
“Evergreen” is a broad term to describe any perpetual, semi-liquid investment vehicle. There are several types of evergreen funds:
- Tender offer fund: a fund offering periodic liquidity by making tender offers to repurchase shares at NAV (liquidity is not guaranteed).
- Interval fund: a fund that repurchases a set percentage of shares at NAV at predetermined intervals (often quarterly).
- Non-traded Business Development Companies (BDCs): non-traded investment companies that make debt and equity investments.
- Non-traded REITs: real estate investment trusts structured as evergreen vehicles.
- ELTIFs/LTAFs: semi-liquid private funds for retail investors in Europe/UK.
According to Pitchbook, private evergreen fund AUM is expected to grow from $2.7T in 2024 up to $4.4T by 2029. That’s over a 10% CAGR, and stronger AUM growth compared to private drawdown funds. While evergreens only accounted for 14% of all private capital AUM in 2024, that share is expected to rise to 18% over the next five years.
Long Angle has participated in a few evergreen offerings, including:
- Chicago Atlantic Credit Opportunities: private credit
- KKR Private Equity Conglomerate: private equity
- StepStone Private Markets (SPRIM): broad asset private market secondaries
- StepStone Private Equity Strategies (STPEX): private equity secondaries
Why Invest in Evergreen Funds?
The following table provides a comparison between evergreen funds and traditional closed-end private market funds. For many investors, the liquidity and periodic fundraising advantages of evergreens make them the more attractive (and convenient) investment option.
However, investors should be aware that the liquidity offered by semi-liquid funds comes with marginally lower returns on deployed capital because a liquidity sleeve is invested in cash equivalent, low return liquidity sleeves (like treasuries).
Potential Downsides to Evergreens
Investors should also be aware of the potential downsides of evergreen investments:
Cash drag: evergreens keep a liquidity sleeve (cash, public equities, or liquid credit) to handle redemptions. This dilutes exposure to private markets and could lead to lower returns compared to being fully invested in drawdown funds. The extent of this drag depends on how much liquidity is being offered.
Valuation challenges: the net asset value (NAV) of an evergreen fund and its underlying assets are typically updated quarterly and rely on GP-reported valuations. In periods of market volatility, NAVs could lag reality.
Redemption gating: redemptions are usually capped at a certain percentage of NAV per quarter. In stressed markets, if the cap is hit fund managers invoke a gate where liquidity requests are either met pro rata or deferred to a later redemption window.
To illustrate these risks in practice, Blackstone’s Real Estate Income Trust (BREIT)—a semi-liquid, open-ended real estate fund—faced scrutiny in 2022 over its valuation methods, with critics noting a reliance on assumptive discounted cash flow models rather than appraisals or tight comparative property cap rate comparables. In December 2022, redemption requests surged amid broader concerns about real estate and BREIT’s outlook. Once requests exceeded the fund’s preset limits (2% of NAV monthly and 5% quarterly), Blackstone capped redemptions, fulfilling less than 10% of requests in December according to Blue Vault. Barron’s reported the gate meant only about 0.3% of BREIT’s $69 billion NAV was actually redeemed that month (about $200 million).
Incentive to deploy capital: managers are incentivized to have as little cash on hand as possible (outside the liquidity sleeve) because it drags down the returns of the fund. If fundraising outpaces deal flow, the manager could be incentivized to seek subpar investments to deploy capital sooner compared to a drawdown fund that only calls capital when an acquisition is in the pipeline.
Performance Characteristics
Even though evergreen funds are subject to some level of cash drag in order to provide liquidity, the return on committed capital benefits from full upfront deployment.
Full upfront deployment with evergreens allows compounding to begin on day one. This means evergreen funds require lower annualized returns on deployed capital to achieve the same multiple on invested capital (MOIC) as closed-end funds.
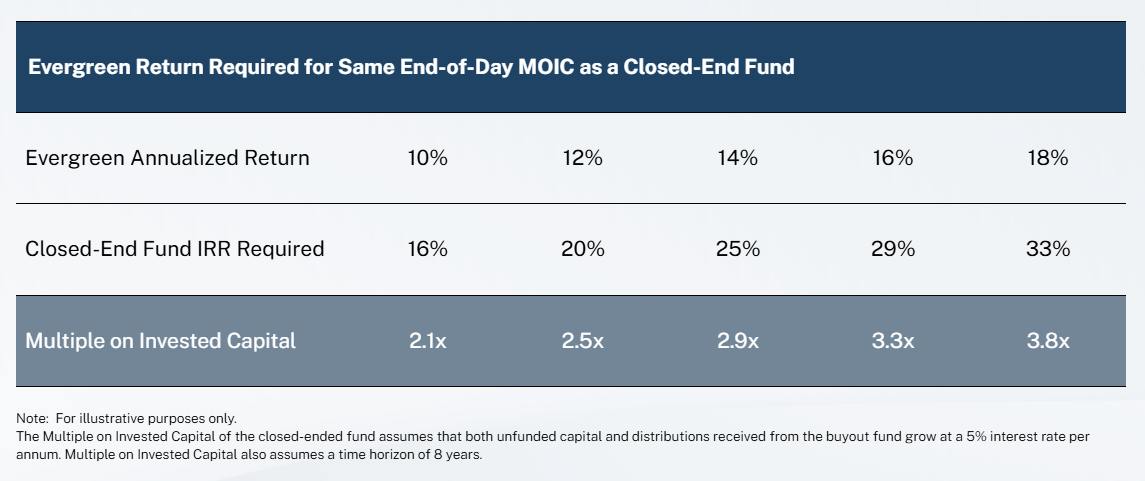
Hamilton Lane illustrates the compounding advantage of evergreens in the below chart, which compares the returns required by evergreen and closed-end structures to achieve the same MOIC. The analysis assumes an eight-year horizon, with unfunded capital and interim distributions of the closed-end fund both growing at a 5% interest rate annually. Under these assumptions, an evergreen fund that is fully deployed from day one would only need a 10% annualized return to grow capital by 2.1x. By contrast, a closed-end fund with dispersed capital calls would require a 16% internal rate of return (IRR) to reach the same outcome. The gap widens further with higher MOIC targets.
Figure 1: Evergreen vs. Closed-End Fund Returns Required for Same MOIC
This is because it takes longer to deploy every dollar of the committed investment for a closed-end fund. For retail investors who don’t have an equally viable place to invest their capital while waiting for capital calls, this is essentially self-imposed cash drag waiting for drawdown deployment. Institutions and widely allocated private investors have many more tools to manage these drawdown schedules and thus typically opt for drawdown vehicles, while retail investors might prefer the evergreen offering.
Therefore when it comes to evergreens’ performance, a tradeoff exists between the cash drag negatively affecting returns and the benefit of full deployment compounding over time. Due to evergreens’ relatively recent emergence and many of the largest funds having launched within the last five years, analysis of performance over time is limited.
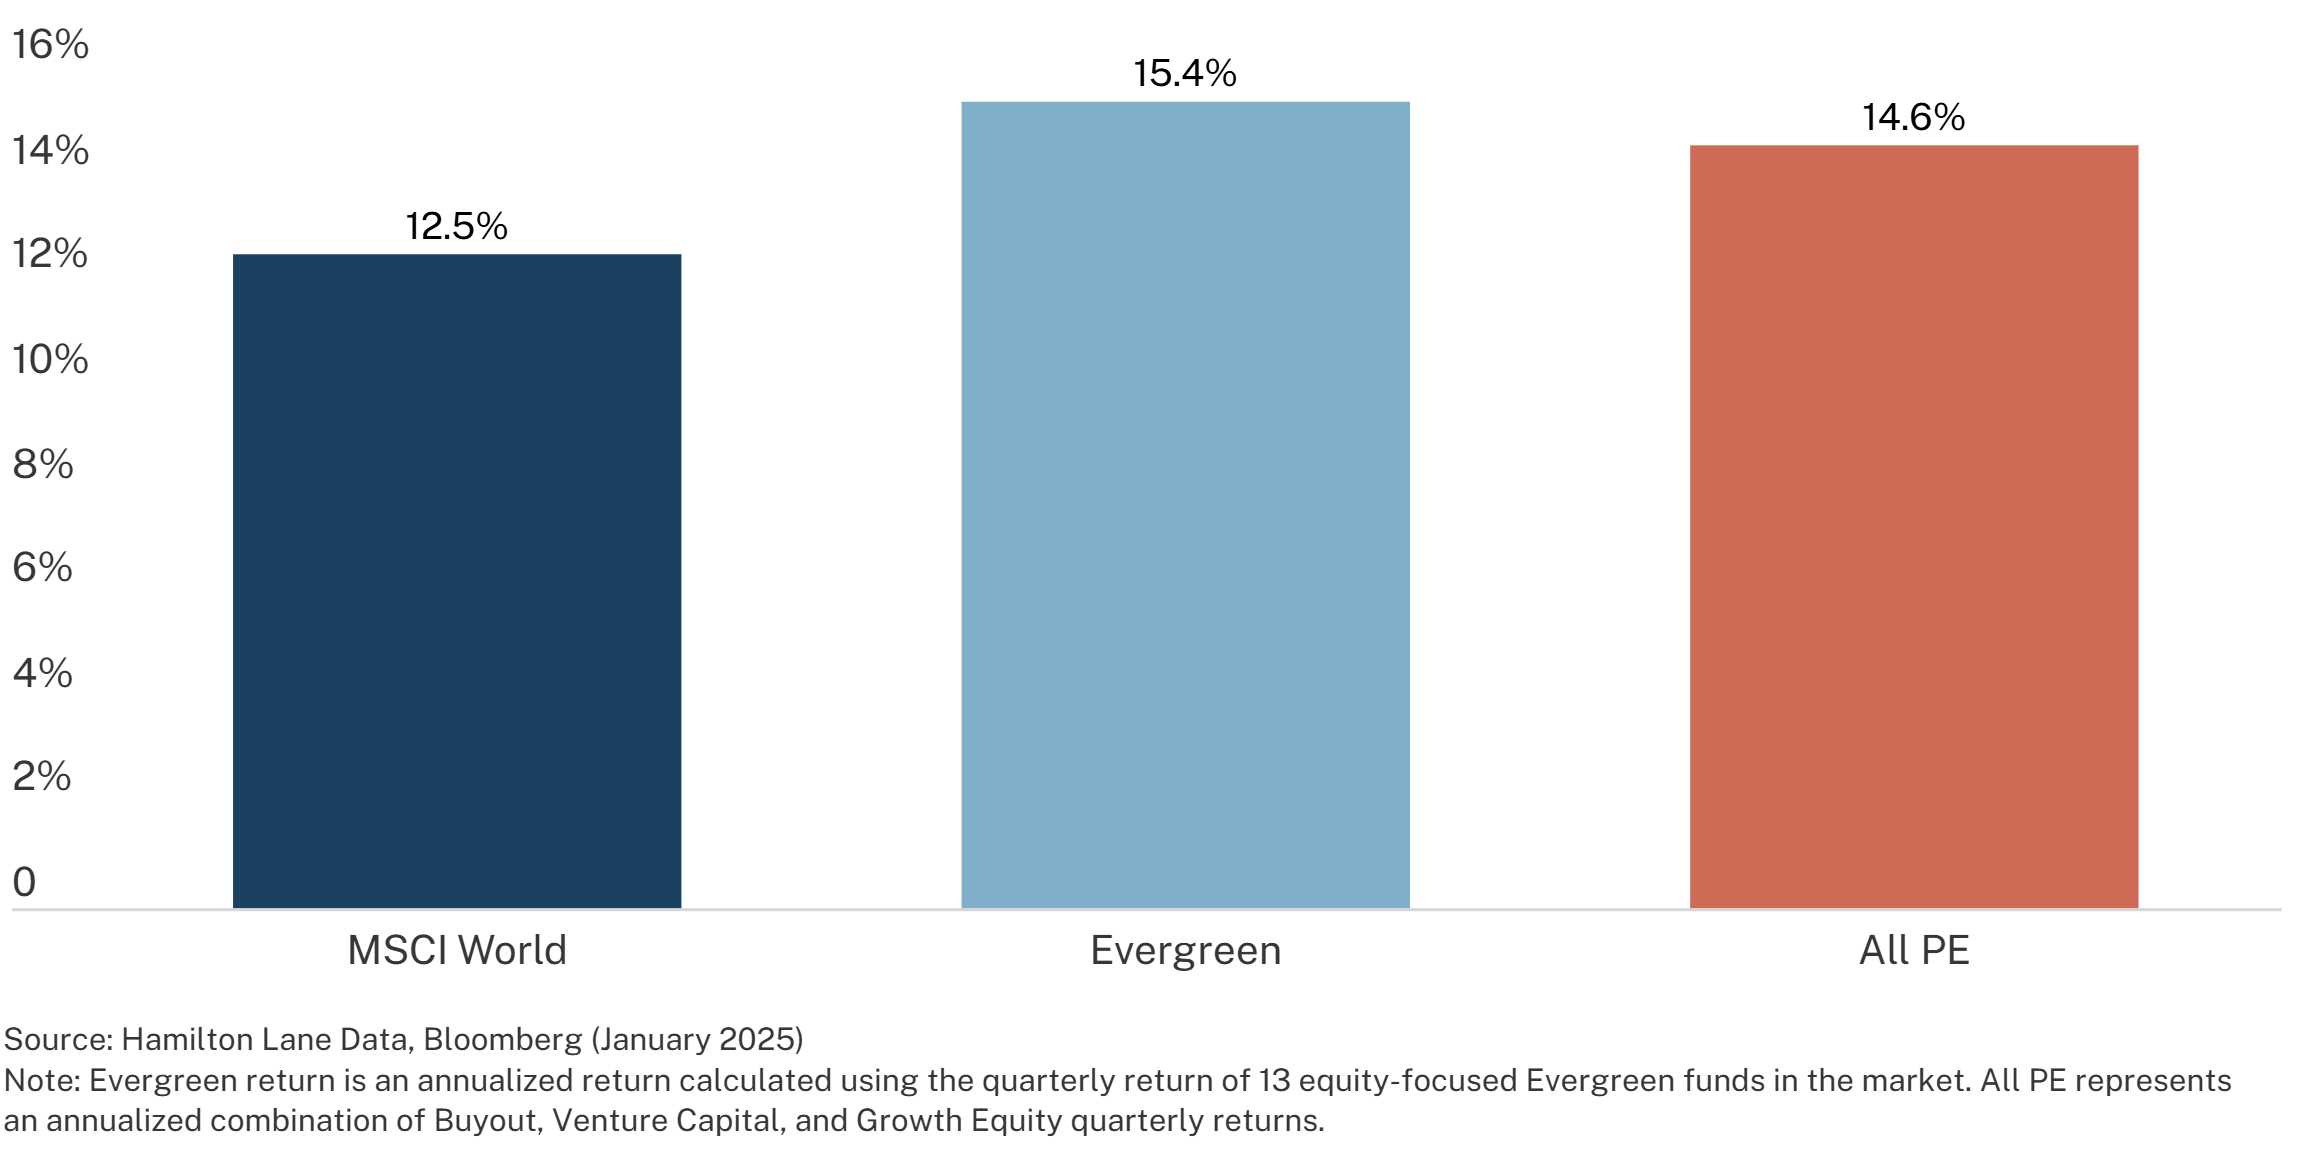
Hamilton Lane analyzed the annualized returns of 13 equity-focused evergreen funds between 2019 and 2024. They found that evergreen funds outperformed public markets (MSCI World public benchmark) and actually performed slightly better than closed-end private equity.
Figure 2: Annualized Returns Q3 2019 - Q3 2024
Evergreen Performance by Asset Class
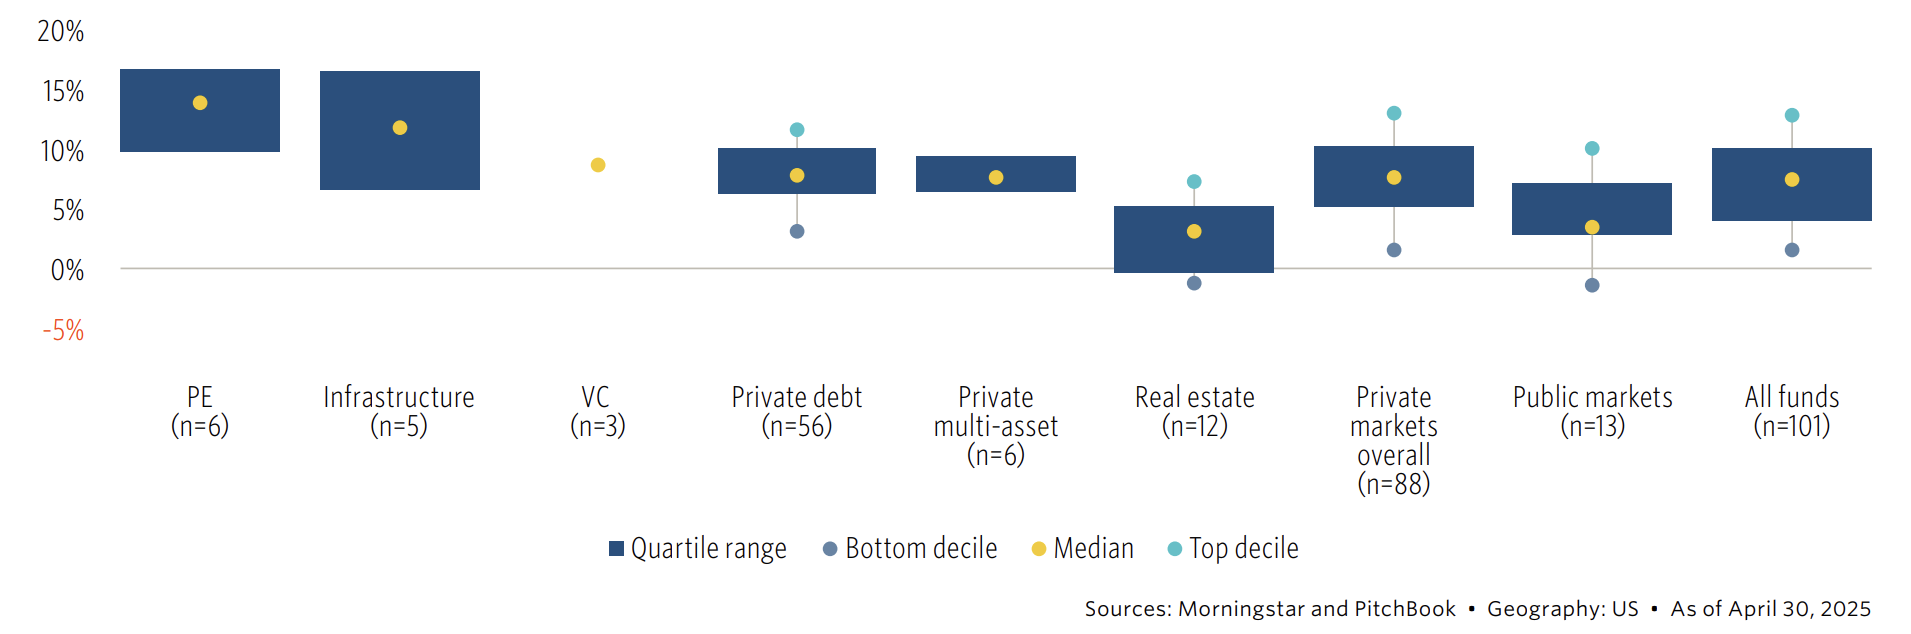
In a recent Pitchbook Analyst Note, the team analyzed one-year and five-year returns of evergreen funds across asset classes and compared them to public markets. Looking at one-year median returns through April 2025, evergreen strategies outperformed public markets. Private equity and infrastructure had the highest one-year median returns, albeit having smaller sample sizes.
Figure 3: One-Year Return Dispersion by Evergreen Fund Strategy
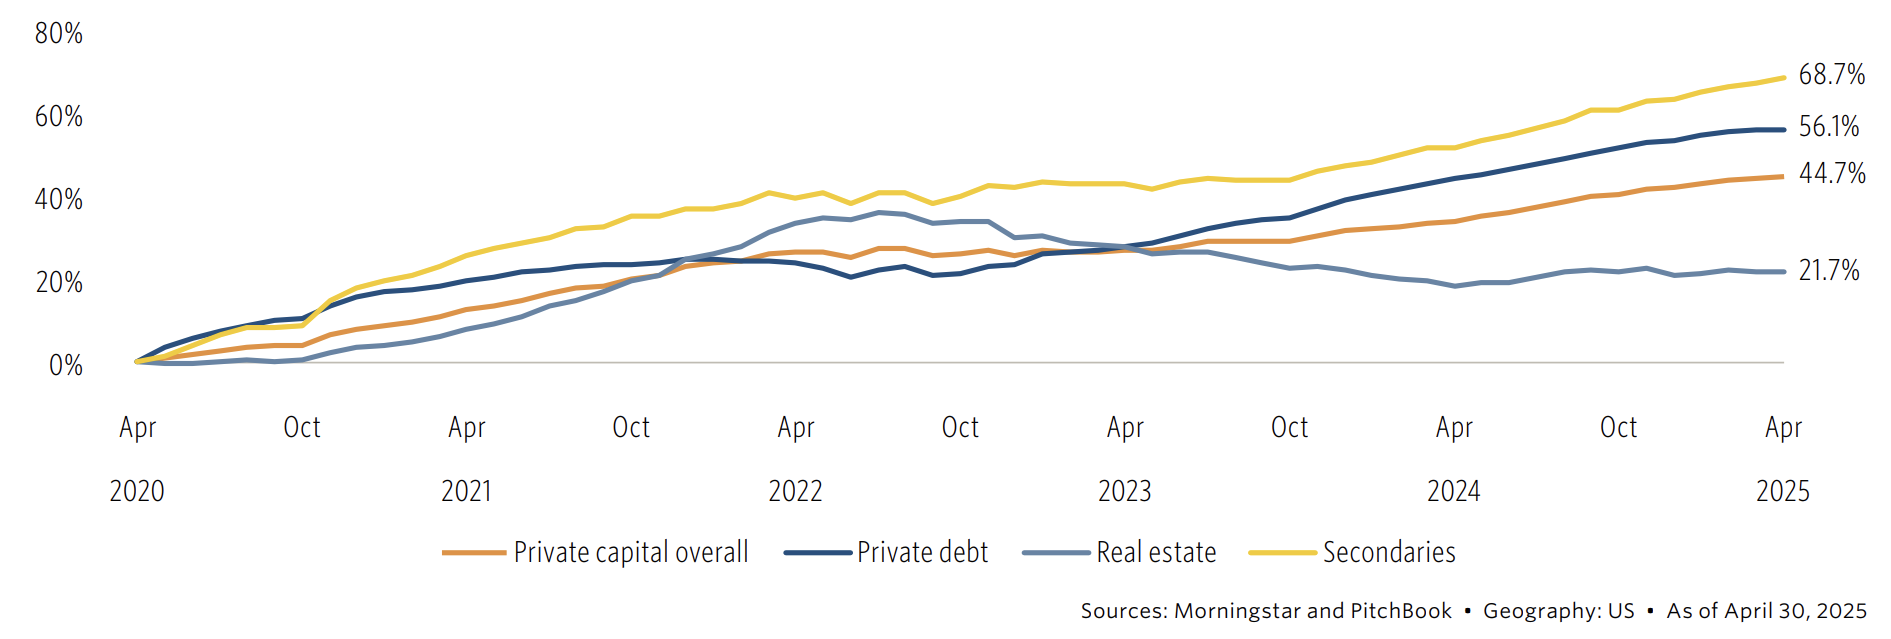
For five-year returns, only private debt, real estate, and secondaries were analyzed due to data availability over the longer time horizon. Secondaries and private debt posted strong 50%+ five-year returns. While private debt outperformed public markets, real estate did not.
Figure 4: Five-year returns of select evergreen fund indexes
In summary, while the above analyses are admittedly limited due to small sample sizes and/or short time horizons, they do provide early evidence for evergreen strategies outperforming alternatives.
How to Evaluate Sponsors
Due diligence framework
Investors should carefully evaluate the following before committing capital:
Manager experience: deal sourcing, due diligence, portfolio construction approaches, operations. The manager’s ability to fundraise and manage the fund is critical.
Track record across market cycles: net returns, risk-adjusted returns, consistency across funds and vintage years, comparisons to benchmarks.
Valuation policy: how are the underlying assets valued and does it make sense given the overall market environment?
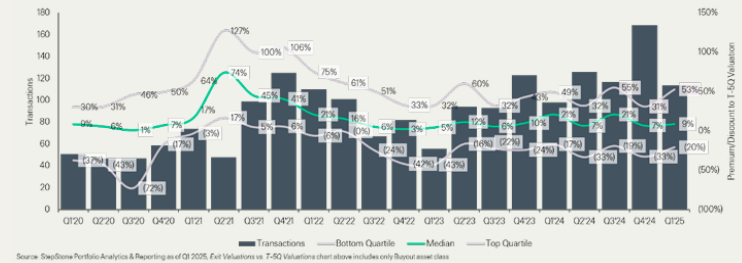
Realization record: to the point on valuation, how close is the manager’s record in evaluating the net asset value before disposition? The best managers realize returns well in excess of pre-sale valuations bolstering the investment thesis; the worst managers realize returns below where they hold the assets, significantly dragging the portfolio and drawing into question the validity of their marks.
The chart below is an analysis by StepStone that compares the top quartile, median, and bottom quartile of private equity fund managers and the premium or discount of the exit valuation to their evaluations 5 quarters prior (T-5Q). Anything over 0% means positive realized returns.
Figure 5. Exit Valuations vs. T-5Q Valuations
Fees: It is important to take a close look at the underlying fee structure for all funds. An analysis by Hamilton Lane found that when accounting for carried interest, evergreen funds have a lower expense ratio to NAV than closed-end funds, typically due to most capital being invested immediately so investors aren’t paying fees on uninvested (committed) capital. Investors should be hyper aware of the total fee and expanse drag from any investments.
To learn about evergreen secondaries and how first close investors benefit from positive return arbitrage, read Long Angle’s Evergreen Secondaries Investment Guide 2025.
Long Angle members can reach out to the Long Angle Investments team with any questions on evergreen funds, due diligence, and opportunities to invest. Non-members can learn more about Long Angle at longangle.com and apply for membership here.
Frequently Asked Questions
What is an evergreen fund?
Evergreen funds offer private market investors a perpetual investment vehicle without predetermined termination dates.
What are the benefits of investing in evergreen funds?
- Full upfront capital deployment
- Semi-liquidity
- No fixed maturity
- Ongoing fundraising
- Broad diversification
How do evergreens perform compared to closed-end funds?
Full upfront deployment with evergreens allows compounding to begin on day one. This means evergreen funds require lower annualized returns on deployed capital to achieve the same multiple on invested capital (MOIC) as closed-end funds.
What should investors consider when evaluating evergreen fund sponsors?
- Manager experience
- Track record across market cycles
- Valuation policy
- Fees
Ready to connect with like-minded peers navigating similar wealth decisions?
Join Long Angle, a private community where successful entrepreneurs, executives, and professionals collaborate on wealth strategies, investment opportunities, and life's next chapter.
Alternative investments