Written by Scott Nixon


Lifestyle Creep: What Happens to Spending as Income and Wealth Grow
Lifestyle Creep: What Happens to Spending as Income and Wealth Grow
How spending changes as income and wealth rise, from Long Angle's 2026 Income and Spending Report: where it falls, where it climbs, and where it goes.
Scott Nixon
Lifestyle creep shows up less than you might expect among high-net-worth households. Among working households in Long Angle's 2026 Income and Spending Report, median spending falls from 44% of gross income under $500,000 to 19% above $1.5 million, then rises again to 34% among households with $25 million or more. The figures come from 146 Long Angle members surveyed in September and October 2026, who aren't a representative sample.
Key Takeaways
- Among working households in Long Angle's 2026 study, spending falls from 44% of gross income under $500,000 to 19% above $1.5 million.
- Working households with $25 million or more reverse the pattern, spending 34% of income and more than they pay in tax.
- At $1.5 million or more of income, vacations are the largest of the five categories the study tracks by income, at a median $43,000 a year.
- Only 30% of respondents buy designer or collectible goods, and lifestyle spending runs about $1,000 a month for the typical household.
- The average working household keeps 36% of gross income as free cash flow, more than the 24% it spends.
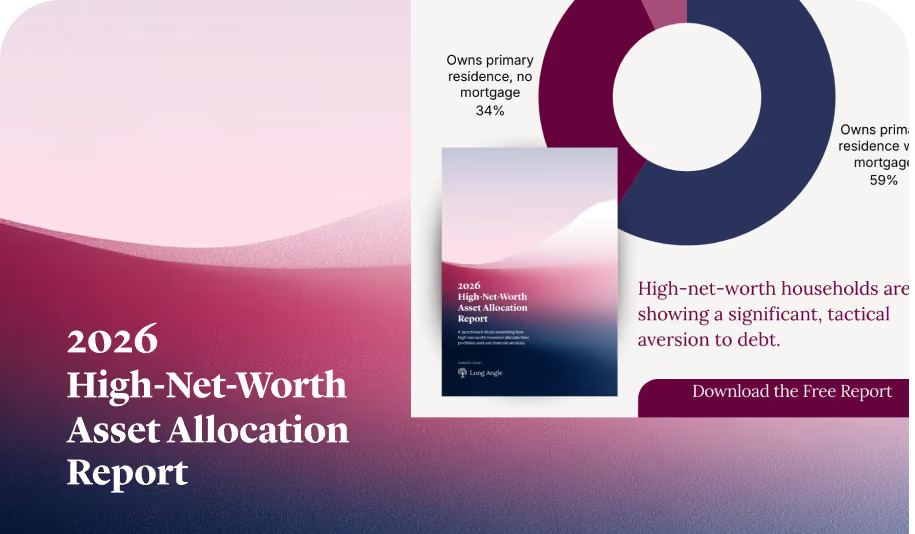
2026 High-Net-Worth Asset Allocation Report
See how high-net-worth investors with an average net worth of $17M are allocating across public equities, private markets, real estate, bonds and cash. Based on benchmark data from 230+ respondents.
What Is Lifestyle Creep?
Lifestyle creep, also called lifestyle inflation, is spending that rises as income rises, until a higher income leaves no more room than a lower one did. The usual advice treats it as a habit to resist. The more useful question for anyone whose income has grown is how much of the increase is turning into spending, and how that compares with people at the same level.
Long Angle's 2026 High-Net-Worth Income and Spending Report answers part of that. Long Angle members reported their household income, taxes, and expenses in dollars for the trailing 12 months, so the study can show what share of income goes to spending at each income and wealth tier.
How Spending Changes as Income Rises
Among working households, spending takes a smaller share of income at every step up. Under $500,000 of gross income, the median household spends 44% of it. Above $1.5 million, that falls to 19%.
| Income bracket | Taxes | Expenses | Structural savings | Free cash flow |
|---|---|---|---|---|
| Under $500K | 22% | 44% | 10% | 16% |
| $500K to $1M | 27% | 30% | 7% | 31% |
| $1M to $1.5M | 29% | 23% | 7% | 38% |
| $1.5M+ | 27% | 19% | 3% | 44% |
Source: Long Angle, 2026 High-Net-Worth Income and Spending Report, survey of 146 respondents, September to October 2026. Respondents are Long Angle members and aren't a representative sample of high-net-worth households. Working households, median % of total gross income. Medians are calculated independently and don't total 100%. Expenses exclude mortgage principal, which the report counts as structural savings.
The crossover comes in the high six figures. At $500,000 to $1 million of income, free cash flow, the savings left in bank and brokerage accounts after taxes, expenses, and retirement contributions, reaches 31% of income and passes spending at 30%. Above $1.5 million, free cash flow reaches 44%, the same share that spending takes at the bottom tier.
A falling share isn't the same as falling spending. The report gives these figures as shares of income and prints no dollar totals by tier, so a household at $1.5 million can spend far more in dollars than one at $400,000 while spending a smaller share.
Why Households With $25 Million or More Spend a Larger Share
Sorted by net worth instead of income, working households show one exception. Spending falls from 29% of income at $3 million to $10 million to 24% at $10 million to $25 million, then climbs to 34% at $25 million or more.
| Net worth | Taxes | Expenses | Structural savings | Free cash flow |
|---|---|---|---|---|
| $3M to $10M | 29% | 29% | 7% | 34% |
| $10M to $25M | 27% | 24% | 6% | 39% |
| $25M+ | 21% | 34% | 4% | 42% |
Source: Long Angle, 2026 High-Net-Worth Income and Spending Report, survey of 146 respondents, September to October 2026. Respondents are Long Angle members and aren't a representative sample of high-net-worth households. Working households, median % of total gross income. Medians don't total 100%. No sample size is printed for each tier.
The $25 million tier is the only one in the study that spends more than it pays in tax. The report links the falling tax rate to more income from preferentially taxed sources, such as capital gains and QSBS, and to more active tax planning. Even at this tier, free cash flow at 42% of income still exceeds spending.
This holds for working households only. Among early retirees in the same study, the pattern runs the other way, and the wealthiest tier spends the smallest share of its income. The $25 million tier is also the smallest net worth group in the sample, 16% of respondents, so treat its figures as a direction.
Where the Extra Spending Goes
The report tracks five spending categories across income brackets and finds two patterns. Vacations and lifestyle spending show the sharpest jumps at the highest income bracket. Food and healthcare stay roughly flat as income grows, which the report reads as a ceiling on essentials.
| Category | Median annual spend at $1.5M+ of income |
|---|---|
| Vacations | $43K |
| Food | $25K |
| Daily living | $23K |
| Lifestyle | $20K |
| Healthcare | $11K |
Source: Long Angle, 2026 High-Net-Worth Income and Spending Report, survey of 146 respondents, September to October 2026. Respondents are Long Angle members and aren't a representative sample of high-net-worth households. Median annual dollars among households at $1.5M+ of gross income who spend on each category. The report prints values for the top bracket only.
Within vacations, most of the money goes to getting there and staying there. Hotels and flights take 80% of vacation spending, leaving about 20% for meals, activities, and everything else.
| Vacation spending | Average share |
|---|---|
| Hotels and resorts | 45% |
| Flights | 35% |
| Meals | 8% |
| Activities | 7% |
| Other | 5% |
Source: Long Angle, 2026 High-Net-Worth Income and Spending Report, survey of 146 respondents, September to October 2026. Respondents are Long Angle members and aren't a representative sample of high-net-worth households. Average % of total vacation spending.
For anyone watching their own spending, this is where creep is most likely to show up: the trip gets upgraded long before the grocery bill changes.
What Most High-Net-Worth Households Don't Spend On
Higher spending at the top doesn't mean most households are buying status goods. The typical household in the study spends about $1,000 a month on lifestyle, which covers entertainment, hobbies, fitness, social memberships, and similar costs. Only 30% buy designer or collectible goods.
| Lifestyle category | Share of respondents who spend on it |
|---|---|
| Entertainment and hobbies | 61% |
| Gym or trainer | 49% |
| Designer and collectible goods | 30% |
| Social memberships | 22% |
| Other | 12% |
Source: Long Angle, 2026 High-Net-Worth Income and Spending Report, survey of 146 respondents, September to October 2026. Respondents are Long Angle members and aren't a representative sample of high-net-worth households. Select all that apply, so shares sum past 100%.
Among the minority who do buy those items, the report finds they spend more on them than on any other lifestyle category, a median $10,000 a year. The broader pattern is restraint: the money goes to time, health, and experiences more often than to things.
How to Avoid Lifestyle Creep
The study gives a working benchmark. The average working household spends 24% of gross income and keeps 36% as free cash flow, so it saves more in liquid assets than it spends. Three habits follow from the data.
- Measure spending as a share of income. A dollar budget drifts as income rises; a share doesn't. Compare yours with the median for your income tier in the table above, once a year, using the gross income figure from your tax return.
- Decide which categories are allowed to grow. In the study, the increase lands in vacations and lifestyle while essentials stay flat. Choosing in advance which of those you want to expand turns creep into a decision.
- Route raises and windfalls to savings first. Working households in the study put 12% of income into structural savings, such as retirement accounts and mortgage principal, before anything reaches free cash flow. Setting that amount when income rises keeps spending from absorbing it by default.
None of this says spending more is wrong. The working households with $25 million or more spend the largest share by net worth, and they also keep the most as free cash flow. The point is that the increase is chosen.
Comparing Notes on Spending
Spending is one of the harder subjects to sanity-check, because friends and colleagues rarely share the numbers. Long Angle is a vetted community of founders, executives, and investors who compare notes on decisions like this one, and it's free to join. For a smaller, confidential setting, Trusted Circles put six to eight Long Angle members in a moderated group that meets monthly for three hours by Zoom; Circles are a separate $4,500 a year with a 12-month commitment.
A peer group is where you can ask the practical version of the question: what others at your stage spend on travel and family, what they'd change, and whether a number that feels high is ordinary for the tier.
The full study, including income sources, tax rates by tier, and spending for early retirees, is in the 2026 High-Net-Worth Income and Spending Report findings.
Final Thoughts
Lifestyle creep is usually framed as a failure of discipline. Long Angle members' numbers suggest something narrower: as income rises, spending takes a smaller share, essentials stop growing, and the increase concentrates in travel and experiences. Working households with the most wealth spend the largest share, and still save more than they spend. The useful test is whether you chose where it went.
Frequently Asked Questions
What is lifestyle creep?
Lifestyle creep, or lifestyle inflation, is spending that rises along with income, so a raise or a sale leaves less extra room than expected. Among working households in Long Angle's 2026 study, spending's share of income fell as income rose, from 44% under $500,000 to 19% above $1.5 million.
Is lifestyle creep always bad?
No. Spending more on things you value is a choice. It becomes a problem when the increase happens by default and crowds out savings. In the 2026 study, the average working household still kept 36% of gross income as free cash flow.
How much do high-net-worth households spend?
In Long Angle's 2026 study, the average working household spent 24% of gross income. The median share ranged from 44% under $500,000 of income to 19% above $1.5 million. The report doesn't print dollar totals by tier.
Does spending rise with net worth?
Only at the top. Among working households, the median spending share fell from 29% of income at $3 million to $10 million to 24% at $10 million to $25 million, then rose to 34% at $25 million or more. Among early retirees the pattern ran the other way.
What are examples of lifestyle creep?
In the data, the clearest example is travel: at $1.5 million or more of income, median vacation spending reached $43,000, while food held near $25,000. Other examples are decisions that turn into fixed costs once made, such as adding recurring services or moving the default class of travel up a level.
Spending decisions are easier to judge beside people at the same stage.
Trusted Circles put six to eight Long Angle members in a confidential, moderated group each month. Membership is free to join; Circles are a separate $4,500 a year.
More From Long Angle
Beyond Wealth Newsletter
Navigating Wealth Podcast
Research & Studies
Alternative Investment Education
Blog