Private Credit Investment Guide 2026
Long Angle's Private Credit Investment Guide 2026 is an introduction to the private credit asset class. The comprehensive guide defines private credit and its place in the broader leveraged credit market, breaks down the major strategies — including direct lending, mezzanine debt, distressed debt, asset-based finance, and NAV lending — and explains the primary investment vehicles used to access them. It also covers performance characteristics, key risk considerations, and a framework for evaluating managers.
Contents
Access the Full Investment Guide Here
What is private credit?
The private credit (or private debt) asset class is defined as lending by non-bank institutions to public or private companies. A private credit fund pools capital from investors to make a portfolio of loans backed by company cash flows or assets. The fund manager underwrites and monitors the loans, earning interest income and fees while returning principal and profits to investors.
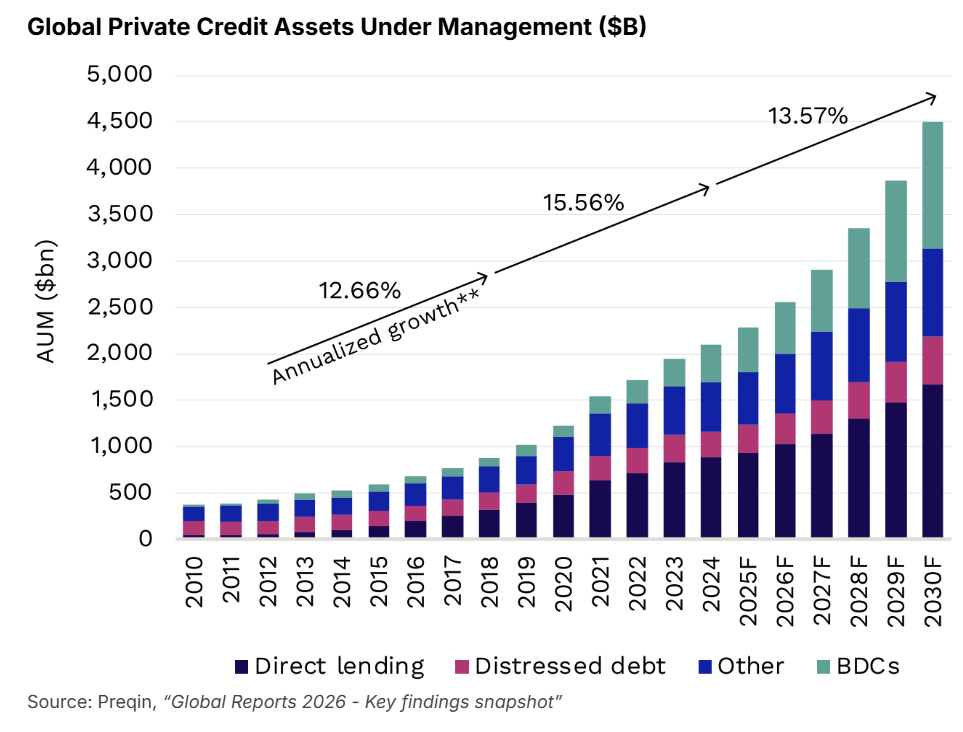
Traditional bank lenders have shifted away from corporate lending after the Dodd-Frank Act of 2010 and the Silicon Valley Bank and related banking failures of 2023. In fact, bank lending as a share of U.S. GDP has been in decline since the Global Financial Crisis: 59% in Q4 2008 down to 44% as of Q1 2025. Private capital has stepped in to fill the void, providing loans that are increasingly difficult to obtain through traditional banks. Private credit assets under management were estimated at over $2 trillion in 2025 and projected to hit $4.5 trillion by 2030.
Private credit has grown in popularity among investors as it offers:
Attractive yields
A compelling risk-adjusted return profile
Downside protection
Portfolio diversification
Floating rate contracts providing inverse correlation to typical bond strategies
Private credit’s place in the leveraged credit market
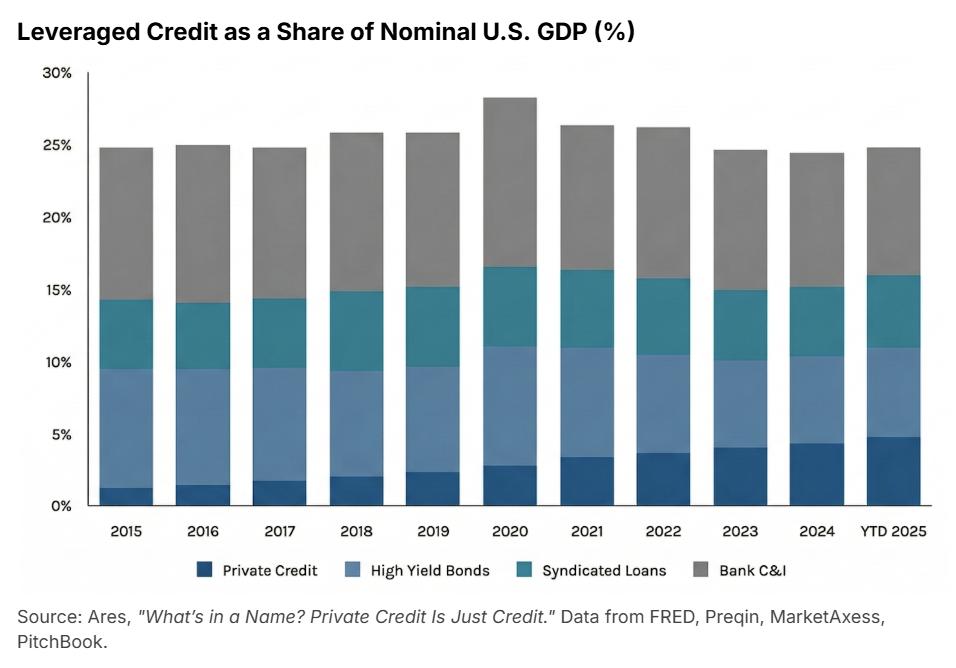
While private credit AUM has expanded significantly, it has come through offsetting the above-mentioned rolloff from the banking and bond sector. Leveraged credit is defined as capital extended to companies below institutional grade or already carrying material debt, and therefore doesn’t qualify as traditional investment-grade debt. Leveraged credit as a share of Nominal U.S. GDP has remained stable for the last decade, with private credit making up a minority portion. This indicates that private credit isn’t necessarily creating new systemic debt or over-leveraging the economy. Instead, it is steadily gaining market share (now ~20%) for existing leveraged credit demand.
Investors should distinguish private credit from its primary "public" or "syndicated" alternatives:
High Yield Bonds: These are publicly traded corporate bonds issued by companies with "speculative-grade" credit ratings (below BBB-). They typically offer fixed interest rates and are traded on open exchanges, providing higher liquidity but exposing investors to greater interest rate risk compared to floating-rate private loans.
Broadly Syndicated Loans (BSLs): Often referred to simply as "Syndicated Loans" or "Leveraged Loans," these are large-scale corporate loans originated by a lead bank and then sold (syndicated) to a wide group of institutional investors. Like private credit, they are typically floating-rate, but they are traded on a secondary market and generally lack the strict lender protections (covenants) and direct relationship found in private direct lending.
Types of private credit strategies
Direct Lending

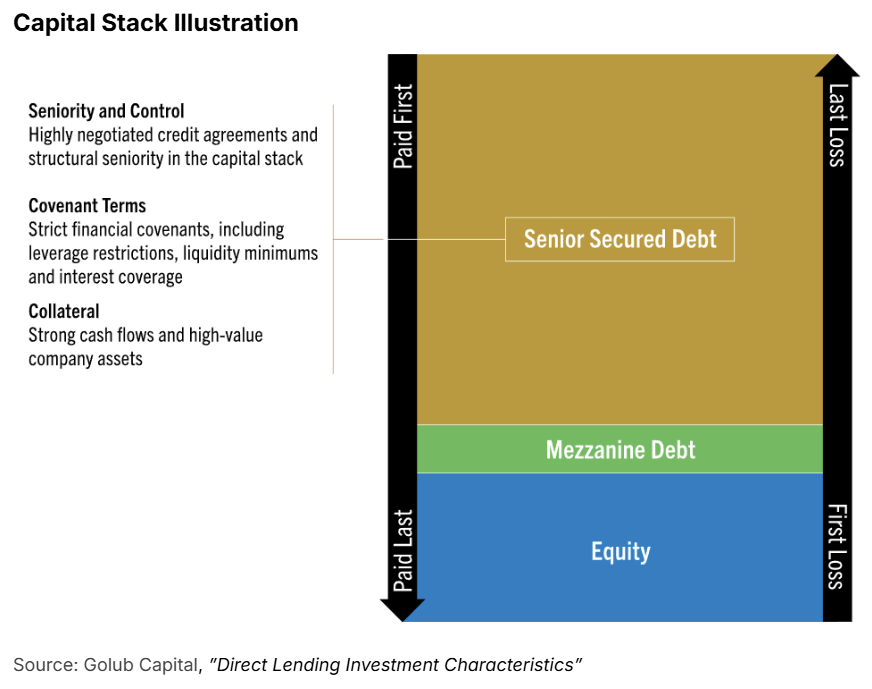
Direct lending is senior secured credit provided to middle-market companies. These loans typically carry low risk and generate stable cash flows. Senior secured debt has priority over all other pieces of a borrower’s capital structure, so this credit is paid off first if a borrower defaults (fails to meet the terms of the loan agreement) before equity and junior credit holders. Historically, default rates for direct lending have been low: under 4% since 2021 according to Proskauer’s Private Credit Default Index.3
These loans are typically floating-rate, meaning the interest rate adjusts periodically based on a benchmark base rate plus a fixed additional percentage, or spread. The most common benchmark is the Secured Overnight Financing Rate (SOFR), which represents the cost that banks pay to borrow cash overnight using U.S. Treasury securities as collateral. For example, a rate of S+200 would mean 200 basis points (2.0%) in addition to SOFR (around 3.7% at the time of this publication). Floating rates mitigate interest rate risk by adjusting with benchmark rate movements, protecting investors from the price declines that often impact fixed rate coupon holders (bonds) when interest rates increase.
Direct lending represents the largest private credit substrategy by AUM and accounted for 38% of private credit capital raised in H1 2025. Most private equity acquisitions financed with debt, known as leveraged buyouts (LBOs), are now funded through direct lending. This is especially true in the middle market (companies with $1–$10B in revenue) where banks have stepped back.
Mezzanine / Subordinated Debt

Mezzanine debt sits between senior debt and equity in the capital structure, meaning the debt is paid after senior debt and before equity in a default or liquidation scenario.
The term mezzanine, or “middle floor,” reflects its middle position (see the illustration below). Any debt paid after senior debt is referred to as subordinated or junior debt, with mezzanine debt as the most common type. Mezzanine debt is also commonly used in LBO transactions.
Mezzanine debt is typically unsecured or lightly secured, has higher interest rates than senior loans, and is often structured with warrants or equity participation. This category has seen a higher 10-year annualized return than senior debt but carries more risk.
Distressed Debt / Special Situations Lending

At the riskier end of the spectrum, distressed debt and special situations lending involves lending to companies undergoing financial distress or restructuring. Distressed debt can be new lending or buying debt of companies already in financial distress or default. Special situations refer to companies experiencing unusual, complex, or temporary circumstances that justify lending at higher rates (e.g., restructuring or event-driven financing).
These strategies are often referred to as “opportunistic” credit: flexible, higher-risk private lending strategies that invest where capital is scarce or complexity is high. Returns may have high upside but the risk of loss and illiquidity are greater compared to other private credit strategies. As with many private asset classes, manager selection is key and private credit is no exception. Top quartile private credit managers outperform median managers by 3.5%. This divergence between managers will be more amplified in sub-strategies such as distressed and special situations lending.
Asset-Based Finance / Real Assets Debt

Asset-based finance (ABF) and real assets debt offer secured (i.e., collateralized) loans, backed by large, diversified pools of assets. These strategies can provide consistent cash flows with moderate risk and returns. Sub-categories include:
Corporate asset-based finance: secured by operating company assets such as inventory, accounts receivable, equipment, machinery, Intellectual Property (IP), and contracts. Also known as asset-based lending (ABL).
Real estate debt: secured by real property, including retail, multi-family, office, industrial, hotels, and land/development.
Infrastructure debt: transportation, shipping, utilities, energy, digital infrastructure (e.g., data centers), and social infrastructure (e.g., hospitals).
Specialty finance: secured by specific financial assets or cash flows rather than by a company’s general credit. Includes consumer loans, auto loans, equipment leases, royalties, litigation claims, insurance receivables, and trade finance.
ABF’s underlying assets could include thousands of home mortgages or car loans across different borrowers, credit profiles, and geographies. The variety of financial and hard assets, plus ABF’s typical emphasis on non-corporate credit exposures, can offer diversification benefits. Historically, ABF has had low correlations (0.50–0.69) with public credit, direct lending, and equities.
Historical returns vary across strategies, with sources pointing to 7%–8% annualized returns:
KKR Asset-Based Finance Fund: 7.03% annualized return (Feb 2020 – Jan 2026).
iCapital: Private Asset-Based Lending proxy: 8.1% annualized return (2017–2024).
PitchBook: Real Assets Debt Index: 7.6% annualized return (10-year, 2024).
ABF and direct lending are increasingly seen as complementary strategies. Paired together, both can deliver attractive income and downside protection: ABF via the underlying collateral pool and credit enhancement (i.e., structural features), and direct lending via seniority, covenants, and controls. Integrating ABF and direct lending can also diversify sources of risk.
Venture Debt / Bridge Financing
Venture debt: loans to venture capital backed startups, often between equity rounds to extend runway, fund growth, or delay dilution and almost always include equity participation. Rates on these loans are very high, often in the 20%+ range.
Bridge financing: short-term loans to cover immediate liquidity needs, meant to “bridge” a company to a future event like refinancing, an IPO, equity raise, or sale.
NAV Lending
NAV lending is a nascent but rapidly growing form of private credit in which a lender provides a loan to a private fund, such as a private equity or private credit fund, secured against the fund's underlying portfolio of assets. The NAV lender is effectively lending against a diversified pool of investments, with repayment supported by cash flows and eventual asset sales within that portfolio.
NAV lending offers potential returns comparable to direct lending, with stronger downside protections. Benefits include risk mitigation through diversified portfolio collateral, downside protection via senior/secured positioning, floating-rate returns, and low public market correlation.
Types of private credit investment vehicles
Investors access private credit through three primary structures. Each vehicle offers distinct advantages regarding liquidity, regulatory oversight, and tax efficiency.
Private Funds
Traditional private credit funds are typically structured as closed-end limited partnerships with a set lifespan, often five to ten years. These vehicles operate on a drawdown model: investors make a formal commitment and the fund manager "calls" that capital as specific lending opportunities are identified. While these funds often require a long-term "lock-up" of capital, they allow managers to stay invested through market cycles without the pressure of daily redemptions.
Perpetual (or evergreen) funds have recently gained popularity, offering investors a way to maintain continuous exposure with more frequent opportunities for limited liquidity.
Business Development Companies (BDCs)
Investors often access direct lending through BDCs, which are regulated investment vehicles that provide exposure to diversified private credit portfolios. They generally fall into two categories:
Private or Non-Traded BDCs: These are not listed on public exchanges and generally require investors to meet specific suitability or qualification standards to participate. They typically offer periodic liquidity (often through quarterly share repurchases) and are valued based on Net Asset Value (NAV) estimates rather than continuous market pricing.
Public BDCs: These trade on major stock exchanges and offer daily liquidity and real-time, market-driven pricing. They have no qualification requirements unlike most private funds, allowing any investor with a brokerage account to participate.
The mechanisms for principal repayment and valuation vary. An investor in a private fund or non-traded BDC will receive monthly or quarterly yield driven by the borrower payments. In a private fund, principal is returned upon loan repayment or asset sale. In a non-traded BDC, principal is recovered through share repurchase programs. Because these vehicles don’t trade on an exchange, their valuations are primarily driven by the performance of the loans and tend to be less reactive to daily market noise. An investor in a public BDC will also receive regular interest payments, but principal repayment will come in the form of share price on public exchanges. This is driven by public sentiment around credit risk and future interest rate and yield expectations.
Structured Credit / Collateralized Loan Obligations (CLOs)
Beyond direct fund investments, managers utilize structured credit vehicles to provide investors with highly diversified pools of debt or access to very specific tranches of risk.
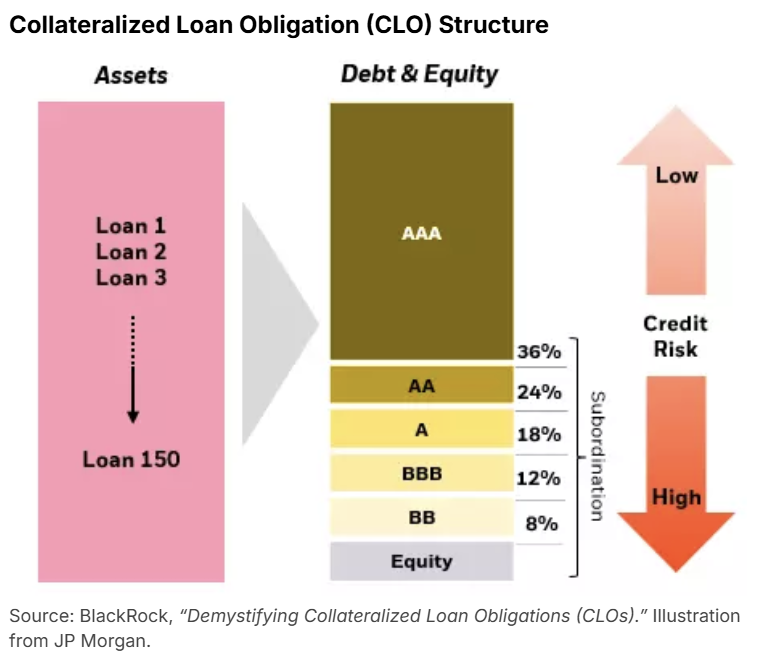
A collateralized loan obligation (CLO) is the most common type of structured credit vehicle; it acquires a diversified pool of senior secured corporate loans and issues multiple tranches of securities backed by the loans’ cash flows. This structure allows an investor to move away from single-borrower exposure and instead gain access to a broadly diversified loan portfolio.
The loan pool is divided into tranches with varying seniority, risk, and yields:
Senior Tranches (AAA to AA): These have first priority on repayments, carrying the lowest risk and yields.
Mezzanine Tranches (A to BB): These sit below senior tranches, offering higher yields in exchange for taking on more risk.
Equity Tranches (Unrated): These absorb losses first but offer the highest potential yields as they receive all "residual" cash flows after the debt tranches are paid.
While CLOs historically have been backed by BSLs to large corporations, private credit CLOs are gaining traction. These are backed by directly originated loans to middle-market companies and often offer a yield premium over traditional BSL CLOs due to their bespoke nature and the complexity of the underlying private borrowers.
Private credit performance
Private credit performance is rooted in the benchmark rates and spreads offered by private loans, which then translate into yield and annualized returns over time. Recall from above, the yield is determined by the base rate (SOFR) plus the spread charged by the lender. Understanding spreads helps explain why IRRs vary by strategy, market conditions, and manager.
Spreads
Private credit spreads are the additional interest earned over the benchmark rate to compensate lenders for risk and illiquidity. Spreads are influenced by demand for capital, credit conditions, and the availability of bank lending (supply). During periods of market stress, with high demand for capital and low supply (lenders tightening), spreads often widen and create more attractive entry points for investors. In strong economic periods, spreads may compress as competition among lenders increases.
Direct lending spreads have ranged between 500–600 basis points (bps or 1/100th of a percent) over SOFR from March 2016 through October 2025. Direct lending spreads have also been roughly 100–200 bps above BSLs since 2023, offering an attractive return premium.
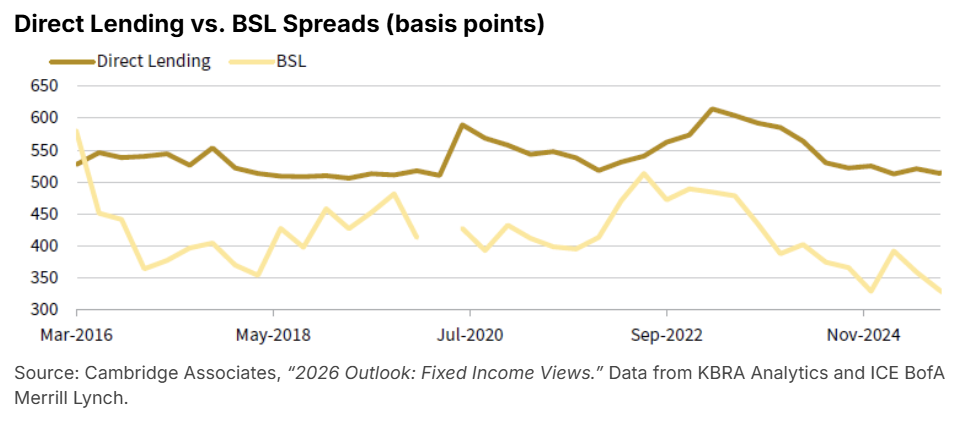
While spreads have narrowed across credit markets recently, senior secured direct lending spreads remain relatively stable and at favorable levels.
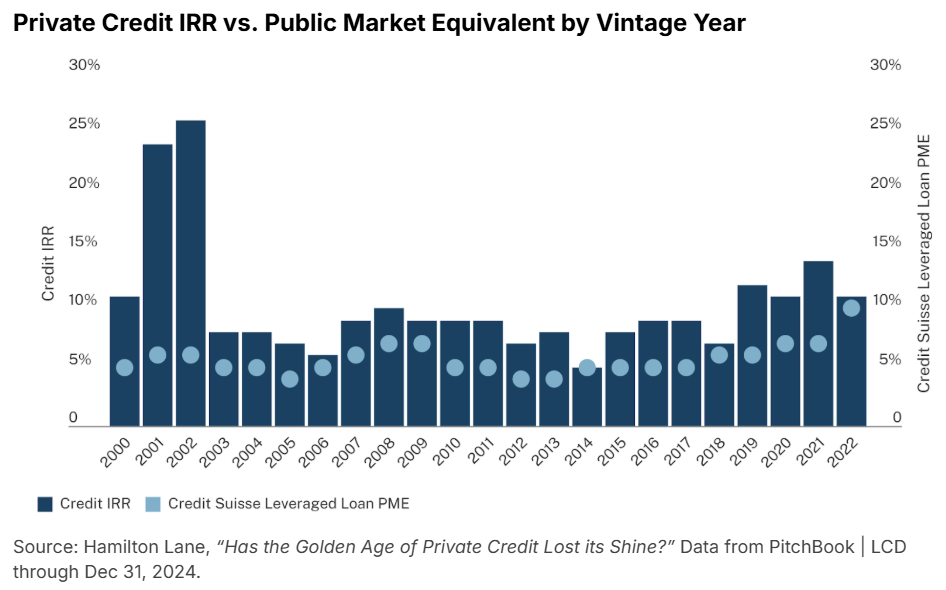
Historical IRRs
Private credit returns have been relatively stable due to the contractual nature of interest payments and short duration of cash flows. IRRs have been positive and have outperformed the public market equivalent for 23 straight vintage years.
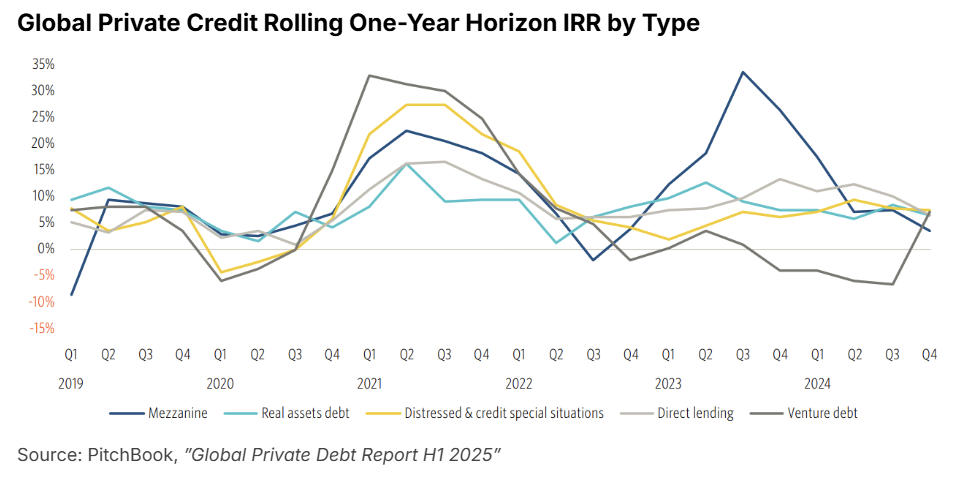
Private credit returns vary based on strategy, seniority, and risk levels. Direct lending IRRs have been in the mid to high single digits and low double digits from 2021 through 2024. Mezzanine, distressed debt, special situations, and venture debt have seen IRRs reach 20%–35% at their highs but have higher risk of loss quarter to quarter.
Private credit performance is influenced by macroeconomic factors including interest rate movements, borrower health and leverage levels, default and recovery trends, and competitive dynamics in the lending market.
While direct lending and other senior strategies have historically low default rates (see the chart below), performance is still tied to economic cycles and manager quality.
Why invest in private credit?
Income Generation
Private credit pays regular interest, providing steady income from the cash flows of private companies. Over the 10-year period from Q2 2015 to Q1 2025, direct lending has generated higher yields than BSLs, high yield bonds, and investment-grade bonds with a shorter duration.
Golub Capital BDC (GBDC), one of the largest publicly traded direct lending vehicles, has delivered 9.5% annualized total returns over the past 15 years. This serves as a useful benchmark for the income potential of the asset class.
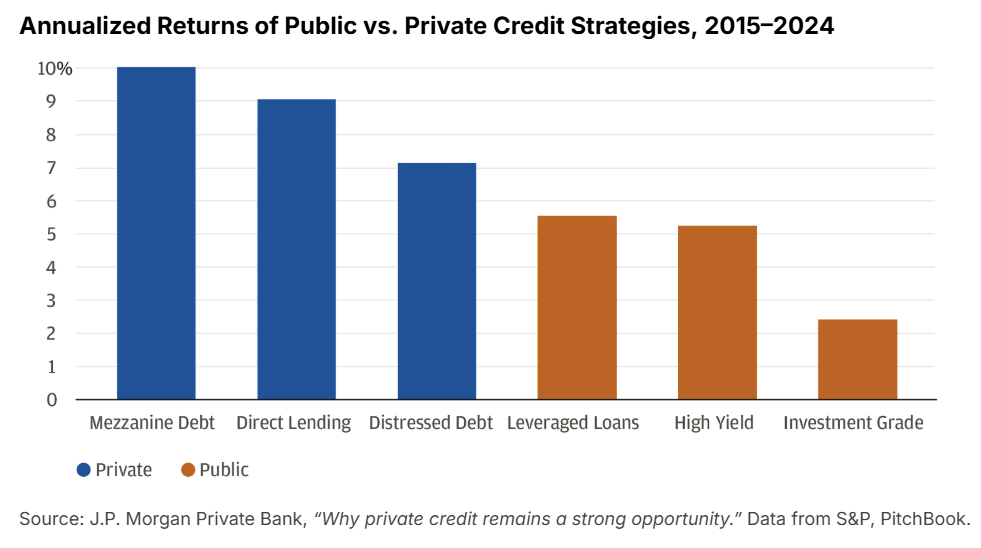
Attractive Risk-Adjusted Returns
Private credit has outperformed public fixed income alternatives over the past decade. From 2015–2024, annualized returns for private credit strategies ranged from approximately 7% to 10% compared with roughly 2.5% to 5.5% for public credit markets.
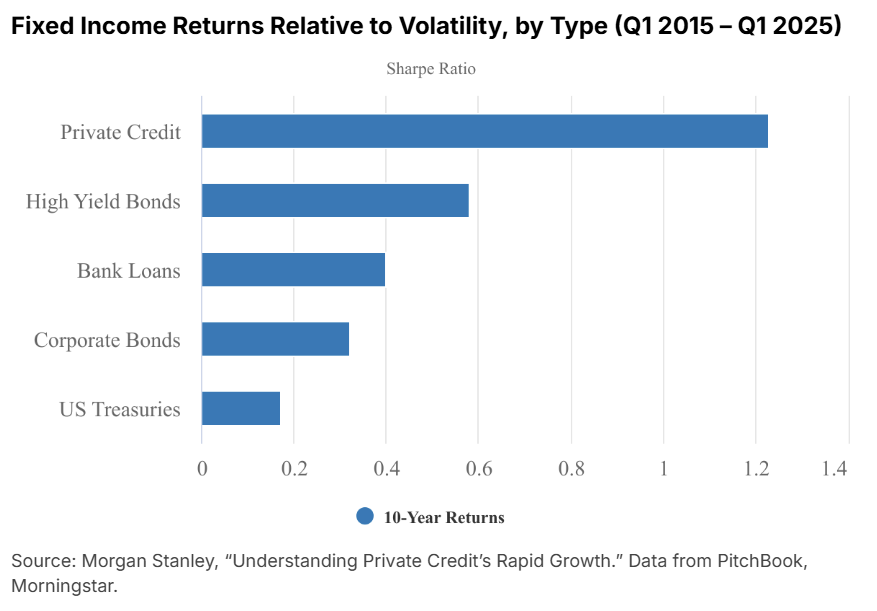
Private credit is recognized for its strong risk-adjusted performance, measured using the Sharpe ratio that quantifies how much excess return an investment generates per unit of risk. By this measure private credit performs quite well, outperforming fixed income comparables over a trailing 10-year period (2015–2025).
Diversification
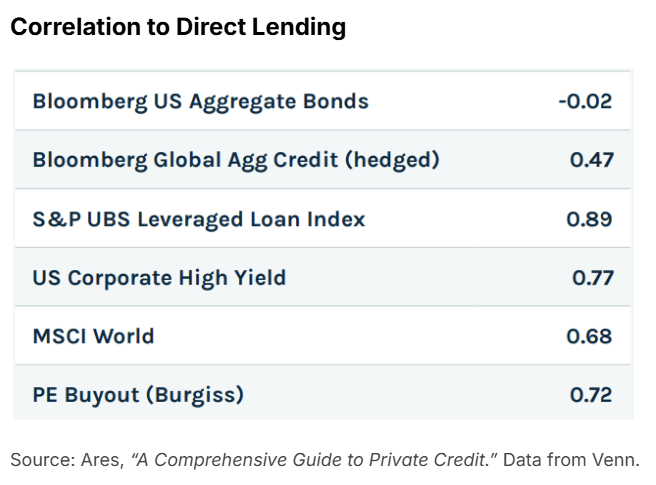
Private credit can complement public equities, private equity, and public bonds as part of a diversified portfolio. Direct lending, for example, has historically exhibited low to moderate correlations across the rest of an investor’s portfolio; with negative 0.02 correlation to bonds (highlighting the floating rate vs. fixed rate distinction discussed above), 0.68 for stocks, and 0.72 for private equity buyout.
Downside Protection
Private credit can provide downside protection during periods of market stress. Managers protect investor capital through:
Regular interest payments driving return immediately
Seniority in the capital structure (when senior)
Structural protections like strong covenants and more investor protections vs. BSLs
Floating rate instruments that adjust to interest rate movements
Conservative loan to value ratios (50% or less for direct lending)
Low historical default rates (under 4% for direct lending since 2021)
Strong historical recovery rates on defaulting loans (above 40% since COVID)
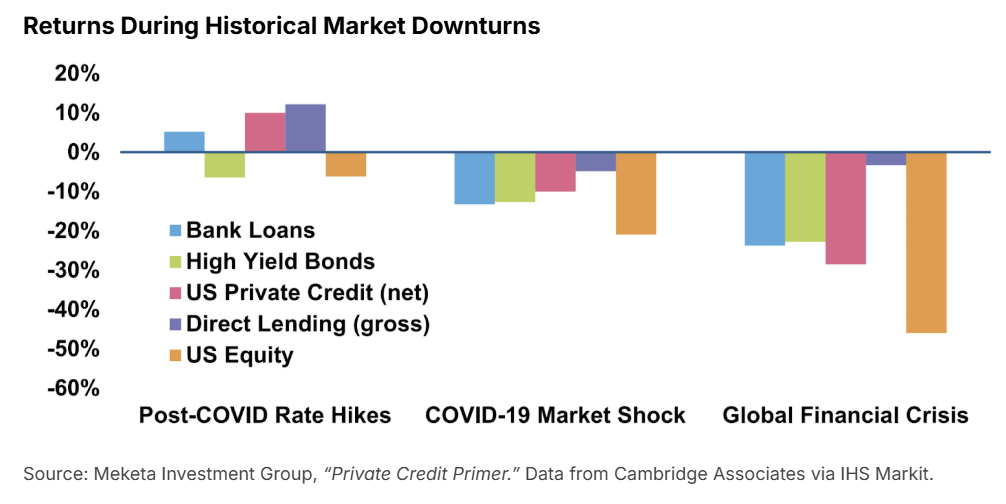
During the three largest market downturns of the last 20 years, direct lending strategies outperformed equity and fixed income alternatives. In the two most recent downturns, the broader private credit market also outperformed.
Risks and downsides
Credit Risk
Default rates and losses vary by strategy. Senior loans have lower default rates, while subordinated and distressed loans carry higher risk.
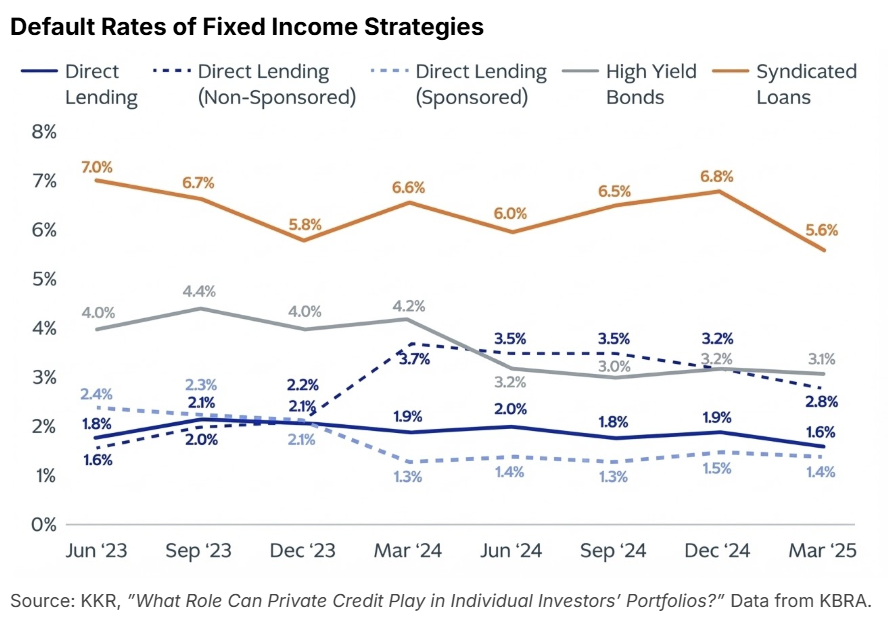
Default rates from June 2023 – March 2025 in direct lending (blue line below) were lower than those of syndicated loans and high yield bonds. While default rates tend to rise in economic downturns, recovery of capital in instances of default has historically been higher with direct lending than high yield bonds due to tighter covenants, according to KKR. Recovery rates on direct lending have averaged around 50% going back to 2013 and were recently reported at 61% for first-lien loans as of Q3 2025, meaning lenders have historically recovered roughly 50 to 60 cents on the dollar in a default scenario.
Interest Rate Risk
Interest rate sensitivity is another consideration, as declining rates can compress lending margins. Floating rate loans mitigate some interest rate risk, but recall that the benchmark rate still lays the foundation for yield, and can increase refinancing risk.
Liquidity Risk
Private credit is an inherently illiquid asset class, with most traditional funds requiring six- to ten-year capital lockups. While this illiquidity is a primary risk, it is also a structural necessity that differentiates private credit from traditional banking sources.
Unlike banks, which are susceptible to "runs" if depositors demand immediate withdrawals, private credit funds utilize committed capital. By aligning the duration of investor capital with the maturity of the loans, managers aren’t forced to sell assets at a loss during periods of market stress, providing a "stable capital" advantage for both the lender and borrower over a full credit cycle.
Manager Risk
Performance dispersion in private credit is significant, with top-quartile funds far outpacing bottom-quartile managers. The interquartile spread of private credit (difference between a 75th percentile manager and a 25th percentile manager performance) is roughly 8%. Investors considering private credit should prioritize managers with a proven track record and robust risk management frameworks.
Downside Risk In Action
Read the second paper in our private credit series, Private Credit Perspectives Q1 2026: Signs of Stress or Sound Plumbing.
At the time of this paper's publication, private credit has been generating notable headlines touching on all four risk areas discussed above. Rising interest rates and higher debt service costs have put pressure on some borrowers, raising credit concerns in certain portfolios. Retail investors in some vehicles have sought early liquidity, only to encounter the gates and redemption limits that are a structural feature of private credit funds designed to prevent disorderly redemptions. And manager quality has proven to matter: the most experienced managers have demonstrated greater flexibility and better outcomes in navigating stress.
As explored in depth in the paper referenced above, recent credit events, including Tricolor, First Brands, and others, suggest that the headlines may not fully reflect the underlying reality of the asset class. We strongly encourage readers to revisit both papers in a year’s time to assess how these situations have developed.
Tax Implications
Private credit investments carry several considerations relevant for tax-sensitive investors:
Ordinary income treatment: Income from direct lending is typically taxed as ordinary income rather than at preferential capital gains rates, a meaningful distinction for investors in upper tax brackets.
1099 vs. K-1 reporting: BDC investors generally receive a 1099, simplifying tax reporting; investors in private funds or separately managed accounts typically receive a K-1, which can delay tax filing and add administrative complexity.
BDC pass-through taxation: BDCs that qualify as regulated investment companies (RICs) pass income through to investors without entity-level taxation, though the predominantly ordinary income nature of that income limits the benefit of preferential rates.
QBI deduction: Depending on the vehicle and investor circumstance, some private credit income may qualify for the 20% qualified business income (QBI) deduction under Section 199A. Eligibility varies and should be confirmed with a tax advisor.
UBTI for tax-exempt investors: Leveraged private credit strategies can generate unrelated business taxable income (UBTI) for endowments, foundations, and certain retirement accounts, potentially creating an unexpected tax liability at the entity level.
As with all tax matters, investors should consult a qualified tax advisor to understand the implications specific to their situation.
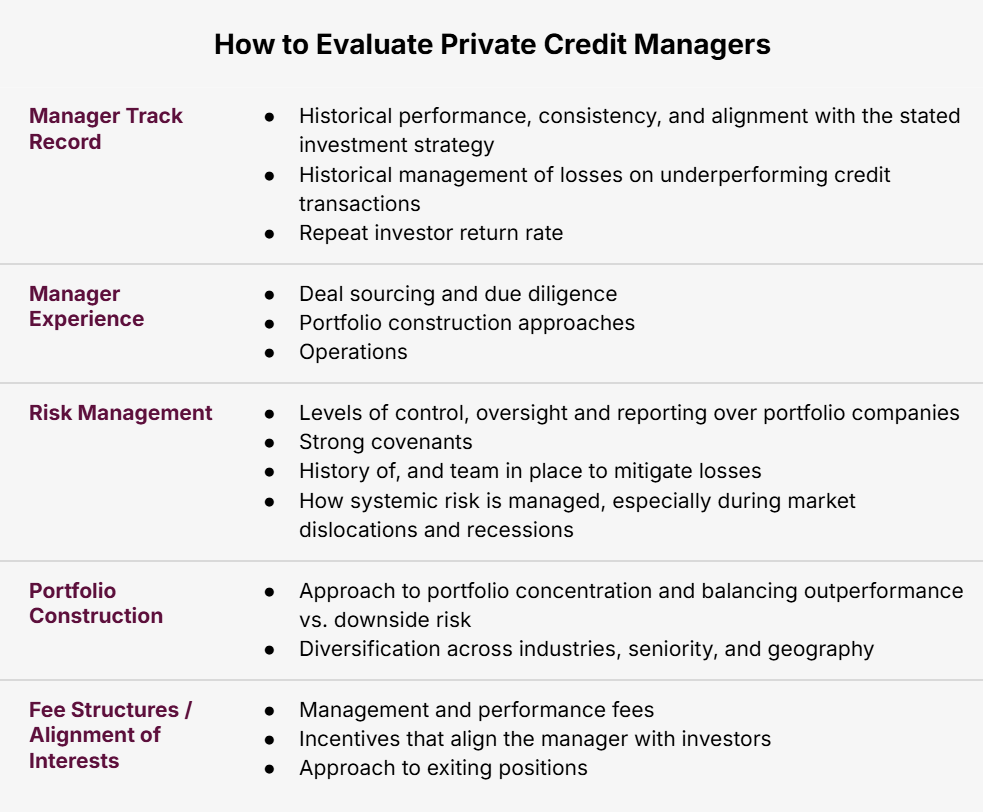
How to evaluate private credit managers
Private credit requires extensive rigor on the part of the investor to make sure sponsors have a strong track record, low historical losses, a repeatable strategy, high underwriting standards, and strong covenants. Investors should evaluate the following before committing capital:
As a benchmark, Cliffwater’s 2025 fee survey of 68 direct lending managers overseeing $1.3 trillion in assets found total effective fees averaged 3.81% of net asset value (NAV), composed of:
Management fees: 1.02% (on gross asset value - GAV) or 1.23% (on NAV)
Carried interest: 12.1% (on GAV) or 14.5% (on NAV)
Preferred return: 6.2% (on GAV) or 6.5% (on NAV)
Administrative expenses: 0.45% of NAV
Download the guide at the top of this page for the full list of citations.
Long Angle members can reach out to the Long Angle Investments team with any questions on private credit and opportunities to invest. Non-members can learn more about Long Angle at longangle.com and apply for membership here.
Ready to connect with like-minded peers navigating similar wealth decisions?
Join Long Angle, a private community where successful entrepreneurs, executives, and professionals collaborate on wealth strategies, investment opportunities, and life's next chapter.