Private Credit Perspectives Q1 2026: Signs of Stress or Sound Plumbing?
Long Angle's Private Credit Perspectives Q1 2026 examines the wave of headlines surrounding private credit that emerged in late 2025 and early 2026. The paper unpacks the Tricolor and First Brands bankruptcies, the redemption pressures at Blue Owl, Blackstone, BlackRock, Cliffwater, and others, and weighs the competing narratives around credit quality and structural risk. It concludes with a data-driven assessment of default rates, credit spreads, and underwriting standards to help investors separate signal from noise.
Contents
Access the Full White Paper Here
Private credit in the spotlight
Starting in October 2025, the financial media narrative surrounding private credit dramatically soured, with headlines comparing the environment to a "GFC 2.0." To be clear, private credit has been in the media crosshairs for years, with journalists calling for a bubble since 2019. Further fueling this pessimism has been a series of high-profile events, starting with the failure of two large private borrowers last fall: Tricolor and First Brands. These bankruptcies generated massive media coverage, leading to extensive retail demand to exit semi-liquid private credit vehicles. The most notable examples include the restructuring of Blue Owl’s redemption programs and a surge in withdrawal requests at Blackstone and BlackRock BDCs.
To the casual observer, headlines warn of a systemic liquidity crisis, worthless credit, and mounting despair for private markets. This paper examines the "plumbing" of the private credit market to provide the context necessary for readers to form an informed opinion. While idiosyncratic fraud cases and retail-driven redemption spikes created significant volatility, underlying credit fundamentals suggest the "crisis" may be more a matter of misunderstood investment structures and market sentiment rather than structural failure.
The following timeline provides clarity on these developments.
How did Tricolor and First Brands trigger the credit hysteria?
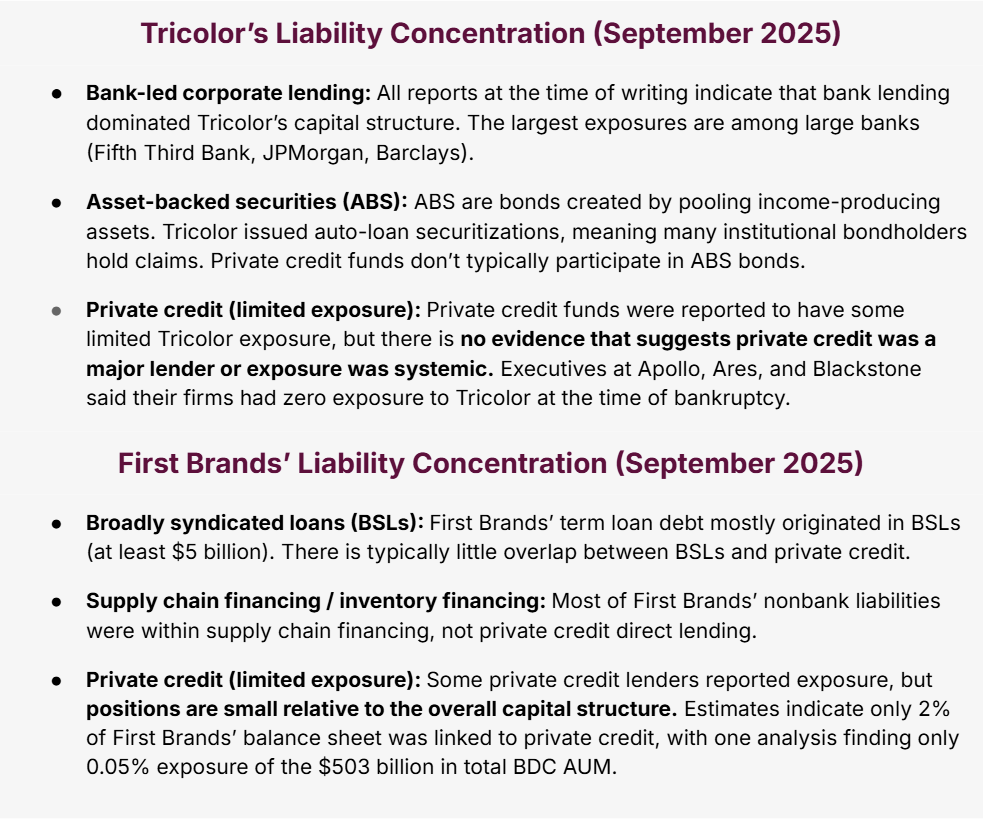
In September 2025, the collapse of two private companies made headlines as credit stress events:
Tricolor, a subprime auto lender, filed for bankruptcy after investigators discovered the company had improperly pledged the same auto loan collateral to multiple lenders (double-pledging). Once this was uncovered, lenders froze funding, forcing Tricolor into a Chapter 7 liquidation. The largest lenders were owed more than $900 million.
First Brands, an auto parts supplier, collapsed following creditor allegations of fabricated receivables, the double-pledging of inventory and invoices, and the diversion of cash. When lenders discovered the fraud they froze First Brands’ access to credit lines, creating a cash shortfall that quickly pushed it into bankruptcy. Liabilities totaled $11.6 billion.
Notably, these bankruptcies drew the ire of the media, hinging on two private companies defaulting on very large loans and tying them to the prior prognostications of “private credit bubbles.” After the dust settled, however, it turned out that the private credit industry had extremely limited exposure to these loans, which were originated and held by the institutional banking system. The table below explains private credit’s limited exposure.
While not a direct methodological equivalent, annual default volumes among publicly-rated corporate issuers provide useful context for the scale of these events. First Brands' $11.6 billion in reported liabilities and Tricolor's $900 million in lender exposure are substantially smaller than, for example, the $167 billion in global speculative-grade defaults (primarily BSL and high yield bonds) recorded in 2024. These figures represent an even smaller share of total non-investment-grade default activity when the broader credit universe is taken into account.
What happened with Blue Owl Capital?
In early 2026, the aftermath of the Tricolor and First Brands media coverage began to materialize. Investors in semi-liquid interval funds started trying to redeem at a dramatically increased pace. Financial media then positioned Blue Owl, an alternative asset manager specializing in private credit, as the "canary in the private credit coal mine."
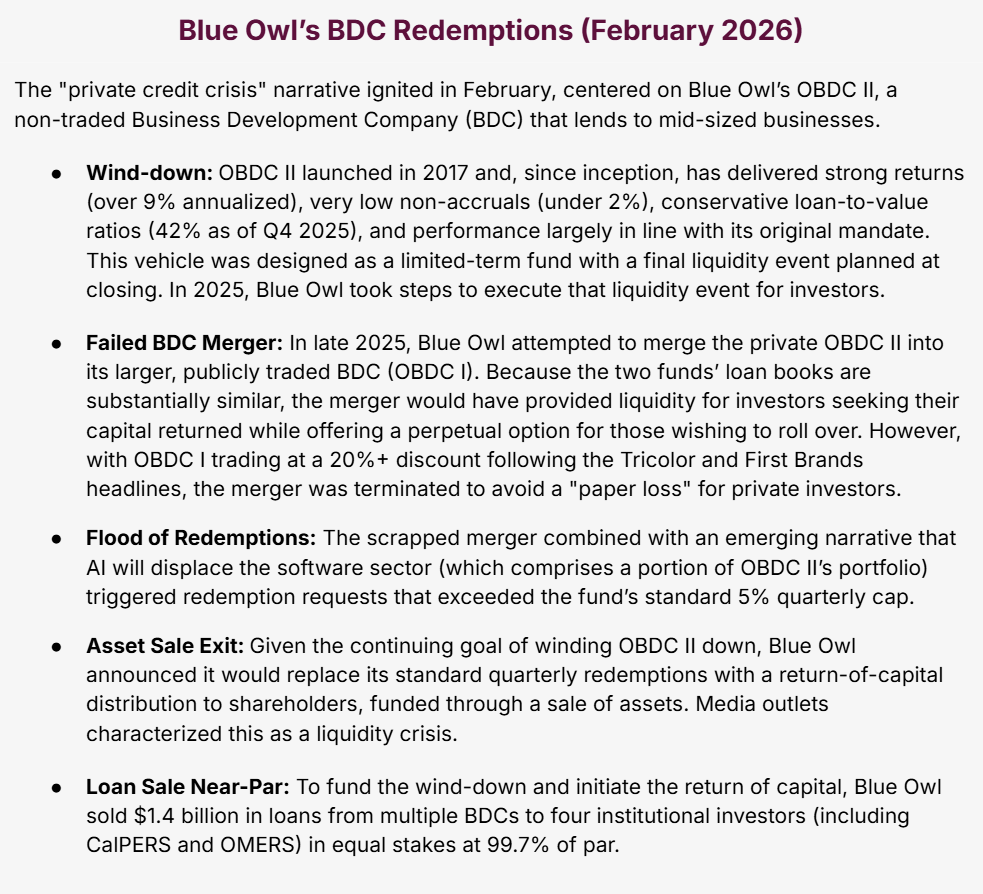
Headlines immediately cast doubt on Blue Owl’s loan sale, propounding three separate narratives:
One of the four buyers that Blue Owl sold to, Kuvare, is its “own insurance asset manager,” making the transaction non-arms-length.
The sale covered only 30% of the fund’s loan book and Blue Owl “cherry-picked the best loans to sell” to present an artificially favorable picture of the portfolio.
Blue Owl “permanently halts redemptions” and investors are unable to get their money back.
While these narratives made for compelling headlines, they also merit a closer look at their validity.
Narrative 1: Non-arms-length transaction
Blue Owl acquired Kuvare Asset Management in 2024 and now serves as a third-party investment adviser to Kuvare's insurance carrier clients. Bloomberg reported that Blue Owl "owns Kuvare" and thus purchased its own assets. Kuvare issued a public statement calling this characterization erroneous, affirming that it maintains independent decision-making authority. Notwithstanding the question of Kuvare's independence, the remaining buyers are unaffiliated with Blue Owl outside of a client relationship. At worst, 75% of the transaction was unambiguously arm's-length.
Narrative 2: Non-arms-length transaction
The OBDC II sale of 34% of its portfolio ($600 million of the $1.4 billion total) was structured as a “strip” sale, meaning partial interests in loans were sold rather than entire positions. The sale comprised 128 portfolio companies which were similar to the composition of Blue Owl’s overall loan book across type, sector, and geography. Only senior-secured, performing positions were included, though the broader loan book also carries junior positions and approximately 1% in non-accrual.
Under the assumption that OBDC I and OBDC II have a similar makeup—a statement Blue Owl itself made previously—roughly 80% of OBDC I is made up of senior-secured positions. While a fuller picture will require additional public disclosures, we can make some hypothetical assumptions:
If we assume the sale consisted of strips representing about 50% of Blue Owl's holding in each included loan, the number of loans that went through independent third-party due diligence would be double the reported 34% of the portfolio: approximately 68%.
If that 68% were independently priced at 99.7% of par, and OBDC I trades at a 20-24% discount to NAV at the time of this publication, that would imply the remaining 32% of the portfolio would need to be worth approximately 37 cents on the dollar to reconcile the two data points. That would represent a historically unprecedented impairment in private credit.
Narrative 3: Redemptions halted, investors unable to get capital back
This narrative is facially false. The redemption mechanism was changed from a standard 5% quarterly tender offer to a structured wind-down. The initial 30% return of capital distribution alone equates to six quarters of redemptions delivered at once, pro rata to all shareholders. The timeline for returning the remaining 70% hasn’t been disclosed, though Blue Owl’s intention is to return capital on an accelerated basis. In February, Blue Owl’s Co-President said they could be in a position to return half of investors’ capital by the end of 2026 (assuming 5% per quarter).
Skeptical perspective: this concern is related to narrative 2: if investors receive only 30% now and the remainder proves difficult to sell or is impaired, the structured wind-down effectively becomes a one-time partial redemption with no clear path to full recovery.
Optimistic perspective: this is a key feature of semi-liquid credit vehicles. Rather than having bank runs or allowing a public vehicle to trade at a discount due to liquidity mismatches, a manager holding strong assets will never become a forced seller. Forced selling under duress can produce capital destruction, as seen in the collapse of Silicon Valley Bank. Private credit’s original appeal is the alignment of long-duration capital with long-duration assets, allowing managers to ignore the noise when making decisions.
How the remaining portfolio sales unfold in 2026 will be the definitive test of whether this wind-down validates or undermines the underlying credit quality.
What happened to Blackstone and BlackRock’s BDCs?
The retail exodus spread to two of the world’s largest asset managers: Blackstone and BlackRock.
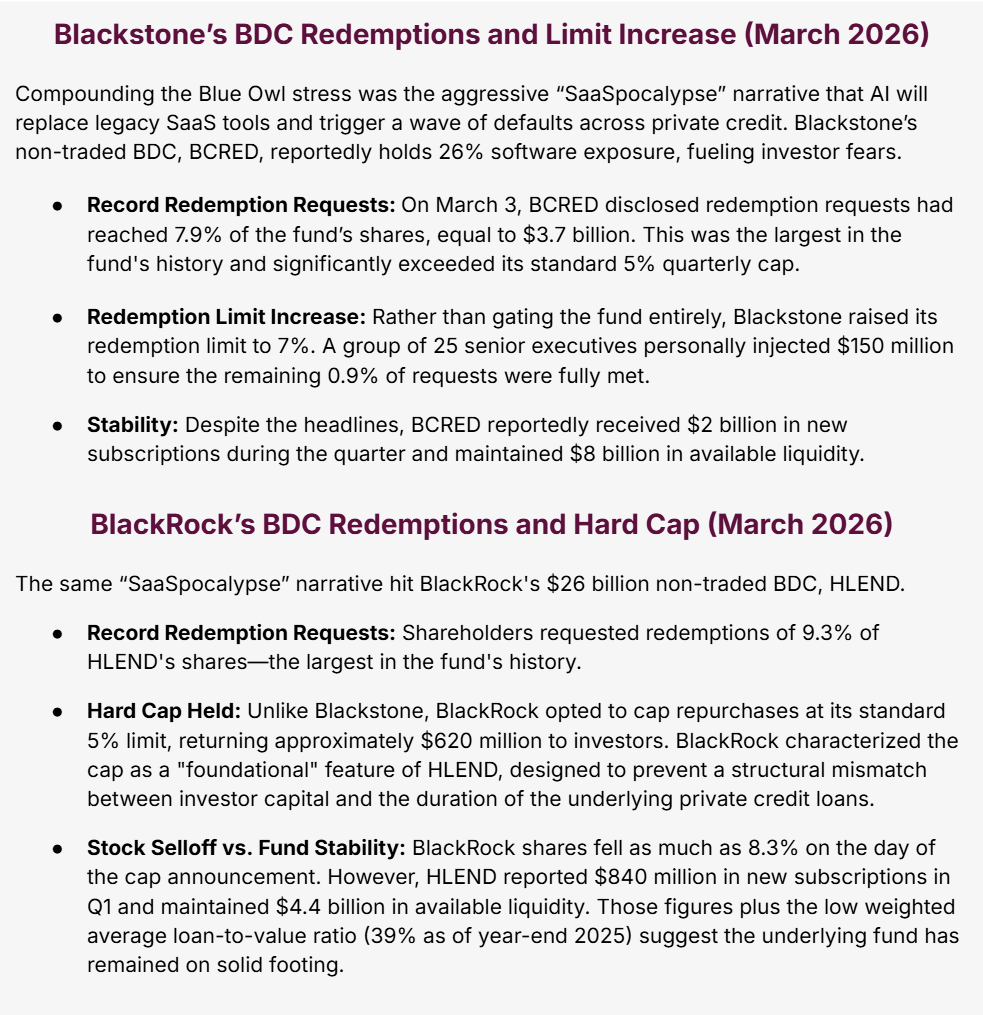
Taken together, the Blackstone and BlackRock episodes illustrate how quickly sentiment can overwhelm fundamentals. Both funds faced record redemption requests driven more by narrative contagion than by observable credit deterioration. By their own metrics, both remained liquid and continued attracting inflows throughout.
Escalating Pressure: Cliffwater, Morgan Stanley, JPMorgan
The stress shows no signs of abating. The most recent developments at the time of writing are:
Cliffwater's $33 billion Corporate Lending Fund (CCLFX), structured as an interval fund, faced redemption requests of about 14% of shares in the first quarter. Cliffwater is capping redemptions at 7%—below the requests but still above its standard 5% quarterly cap.
Morgan Stanley’s non-traded BDC, North Haven Private Income Fund (NHPIF), saw redemptions reach 10.9% of shares and capped withdrawals at its standard 5% limit.
JPMorgan has begun marking down the value of software company loans held by private credit firms as collateral, reducing their borrowing capacity.
These developments mark a potential escalation: redemption pressure is spreading and the banking system is now beginning to tighten the leverage it extends to the private credit industry. If the JPMorgan markdowns are followed by other major lenders, private credit funds could face a dual squeeze: investor outflows on one side, reduced borrowing capacity on the other.
The question is whether the underlying credit fundamentals will deteriorate to justify the concern, or if this remains a liquidity story masquerading as a credit story. After unpacking the last six months of headlines, we now turn to the broader picture: the state of private credit in Q1 2026 based on currently available data.
Evaluating the health of the private credit market
Private credit’s place in the leveraged credit market
Private credit has grown rapidly over the past 5 to 10 years, driven by the expansion of direct lending (see our Private Credit Investment Guide 2026). Prior to these headlines, AUM growth was expected to remain strong at a 10% compound annual growth rate (CAGR) over 2023–2029.
While private credit AUM has expanded significantly, the growth must be viewed within the context of the broader market of leveraged credit. Leveraged credit is defined as capital extended to companies already carrying debt or with lower than institutional credit ratings (typically due to smaller size borrowers), and therefore doesn’t qualify as traditional investment-grade debt. Leveraged credit as a share of Nominal U.S. GDP has remained stable for the last decade, with private credit making up a minority (though growing) portion. This indicates that private credit isn’t necessarily creating new systemic debt or over-leveraging the economy. Instead, it is steadily gaining market share (now ~20%) for existing leveraged credit demand.
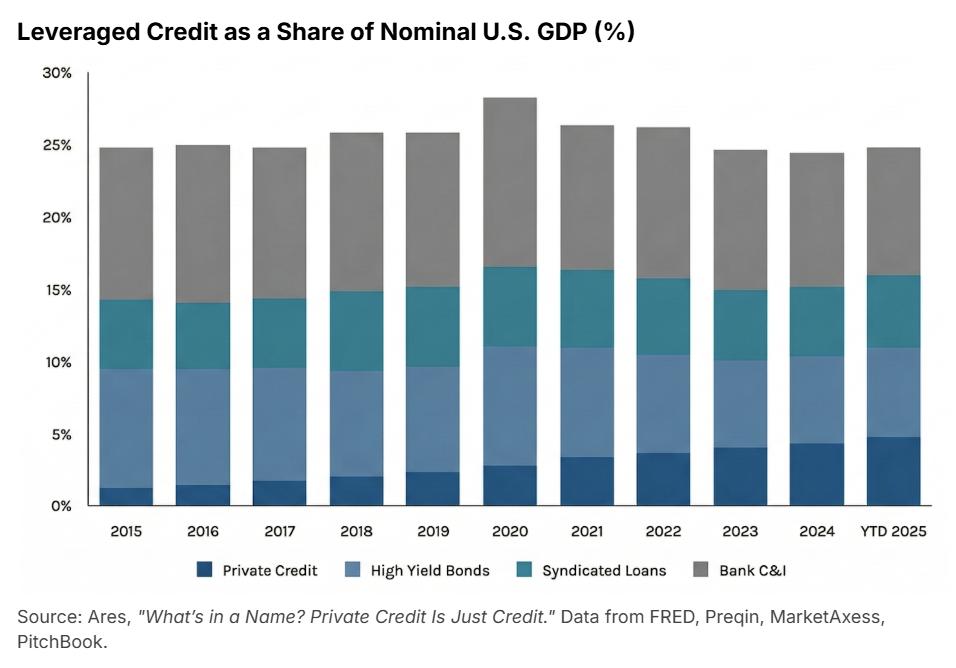
Traditional bank lenders have shifted away from corporate lending after the Dodd-Frank Act of 2010 and the Silicon Valley Bank and related banking failures of 2023. Private capital has stepped in to fill the void, providing loans that are increasingly difficult to obtain through banks.
That said, looking at all corporate borrowing (including bank loans and investment-grade bonds), private credit’s share is still only about 9%. From a systemic risk perspective, the size of the private credit market justifies attention, but private credit exposure does not yet dominate the credit universe in a way where losses would translate to broader credit market collapse.
Default rates
Default rates measure the share of loans that fail to meet the terms of their loan agreements. Rapidly rising default rates would signal the ingredients of a credit bubble: over-aggressive underwriting, deteriorating credit quality, inflated valuations, and weakening borrower cash flows.
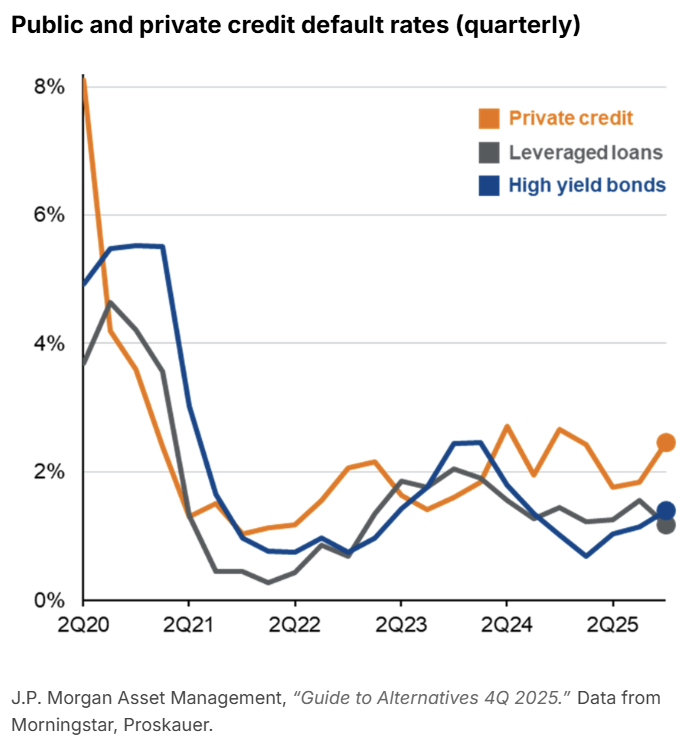
Looking at the larger, safer end of the private credit market where the public managers in the headlines operate, default rates have been consistently under 3% since mid 2021. Proskauer’s Private Credit Default Index, encompassing nearly 700 loans and $145 billion in original principal, reported a Q4 2025 private credit default rate of 2.46%. Proskauer notes that while the default rate is up quarter-over-quarter (vs. 1.84%), the overall picture remains stable (see chart below).
At the other end of the middle market, the smallest companies faced more pressure, with default rates tracked by Fitch Ratings rising from 8.1% in 2024 to 9.2% in 2025. The Proskauer data, given its broader universe of companies, is a more representative benchmark for the funds discussed in this paper.
For historical context, average default rates of corporate loans from 1995–2024 are listed in the following table. Assuming most middle market private direct lending is below $250 million in loan size, current default rates under 3% look healthy in comparison.

The chart below plots 12-month trailing default rates on speculative-grade U.S. corporate debt back to the late 1980s. Every major stress episode—the early 1990s recession, the dot-com bubble, and the Global Financial Crisis—drove default rates above 10%. During the aftermath of the COVID-19 pandemic they briefly reached close to 7%.
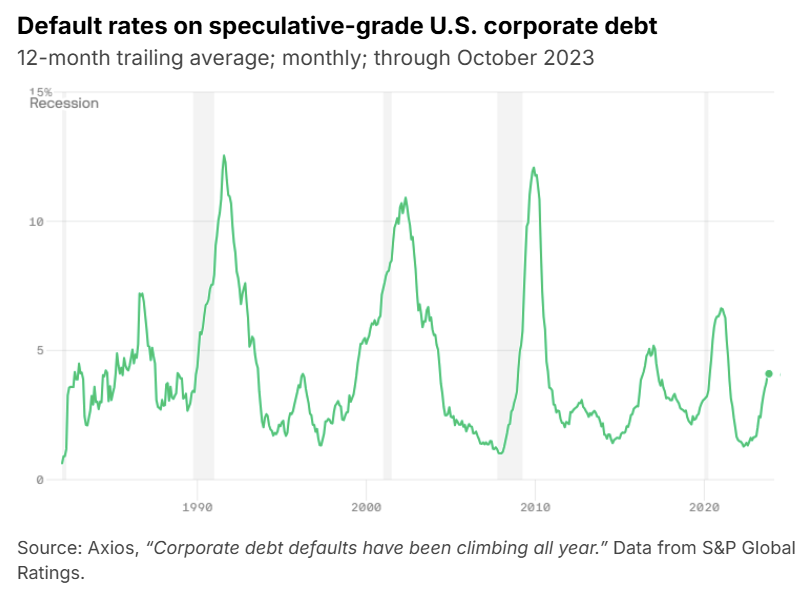
For any critics predicting a GFC-style meltdown, today’s private credit default rates are running nowhere near recession-era highs (yet).
Credit spreads
Credit spreads are one of the clearest leading indicators of credit market stress. Spreads represent the additional yield lenders receive over a benchmark interest rate (such as SOFR or Treasuries) to compensate for borrower credit risk. When risk rises, spreads widen materially.
Private credit direct lending spreads have remained relatively stable between 500–700 basis points (bps or 1/100th of a percent) over SOFR from 2023–2025. Direct lending spreads have also been over 100 bps above BSL and high yield bonds since 2023, offering an attractive return premium.
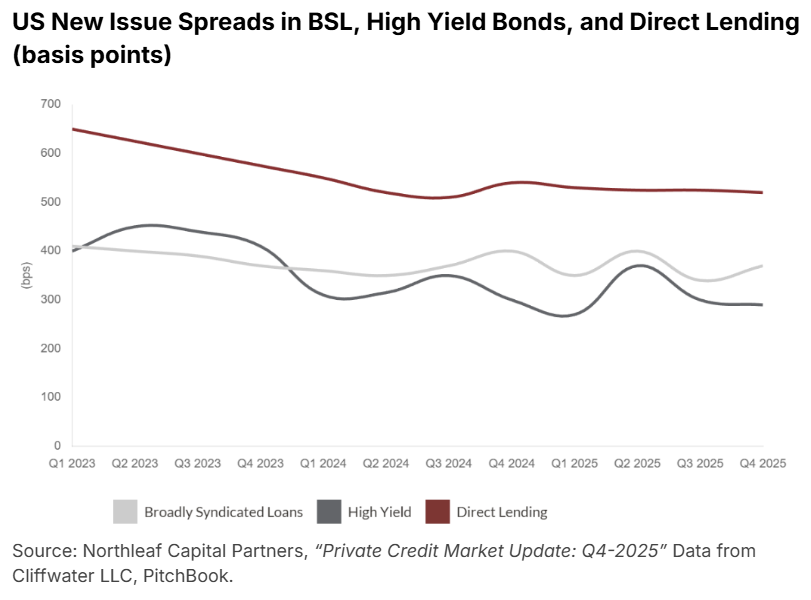
The stability of spreads is strong evidence that there is no system-wide deterioration yet. If private credit were facing real stress or entering a bubble, you would expect to see spreads widen as credit becomes tighter.
A notable counternarrative here is that compressed spreads typically mean fewer loans and more lending capital chasing fewer deals. It is fair to assume that credit quality and underwriting standards start to fall off as lenders compete to win deals. This may very well have been happening for the last few years, we just haven’t seen it reflected in the data. This ebb and flow is typical of credit cycles.
Underwriting standards
To further break down credit stability, underwriting quality reflects how rigorously lenders structure deals, assess borrower financials, set covenants, evaluate cash flow resilience, and size leverage relative to EBITDA. Strong underwriting prevents problems from emerging.
The following two core private credit underwriting metrics remained robust throughout 2025.
Leverage multiples (debt/EBITDA)
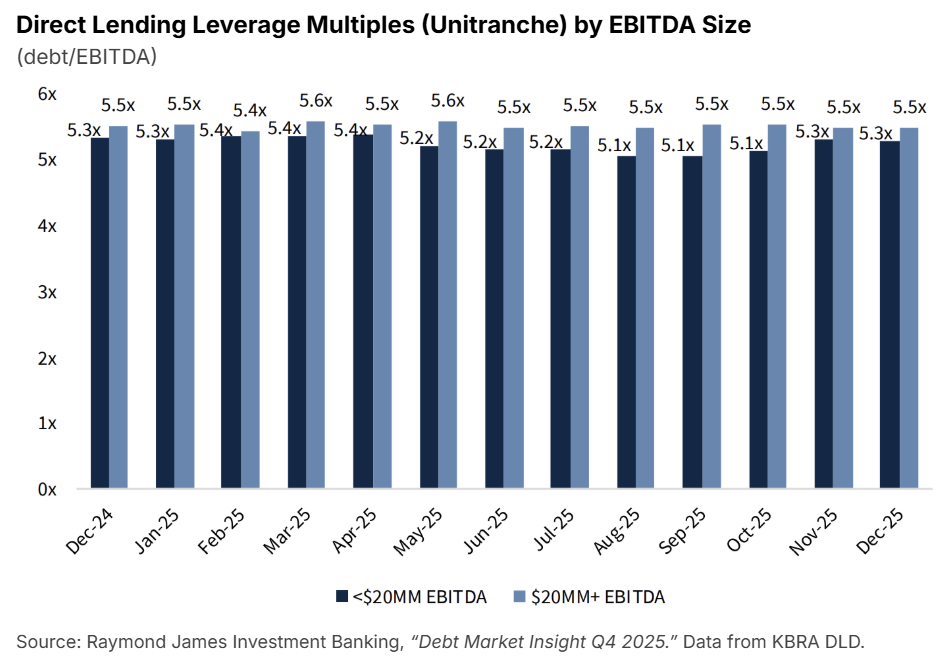
Leverage multiples measure how much debt borrowers carry relative to their earnings. Higher leverage increases default risk and rising leverage multiples indicate looser underwriting standards.
The average leverage multiples for private middle market unitranche loans (combined senior and subordinated debt) remained stable across company sizes throughout all of 2025.
While the data above captures stability within 2025 on a monthly basis, it doesn’t provide historical context for whether current leverage levels are elevated relative to prior years. The following chart addresses this by showing leverage multiples for direct lending LBO transactions—the largest segment of direct lending—broken out by deal size from 2018 through Q3 2025.
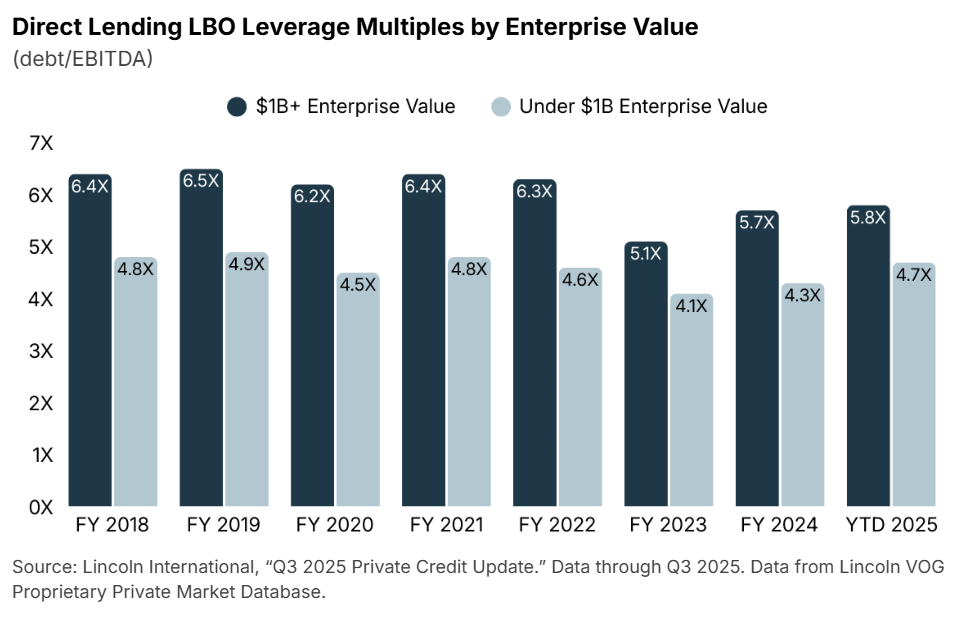
Across both size segments, leverage multiples have stayed within a consistent historical band over most of the eight-year period shown, with no sustained upward trend. Higher leverage among the $1B+ segment reflects lender comfort with larger, more diversified businesses. The trough in 2023 is a result of lender conservatism during the peak rate environment, as elevated borrowing costs made high leverage expensive. While both series saw modest upticks in 2025 as declining rates improved debt serviceability, leverage multiples remained below 2018–2022 averages.
Interest coverage ratios (EBITDA/interest expense)
Interest coverage measures borrowers’ abilities to service interest payments from operating earnings. Lower coverage ratios mean less room to meet loan obligations and declining ratios signal riskier underwriting. As an example at a 2x coverage ratio, a borrower’s profit levels could fall by 50% and still meet debt service obligations.
Interest coverage for the $20M+ EBITDA middle market segment has been fairly stable over the past two years. While lower middle market (<$20M EBITDA) interest coverage has fallen slightly over the past two quarters, it is still consistent with 2024 levels.
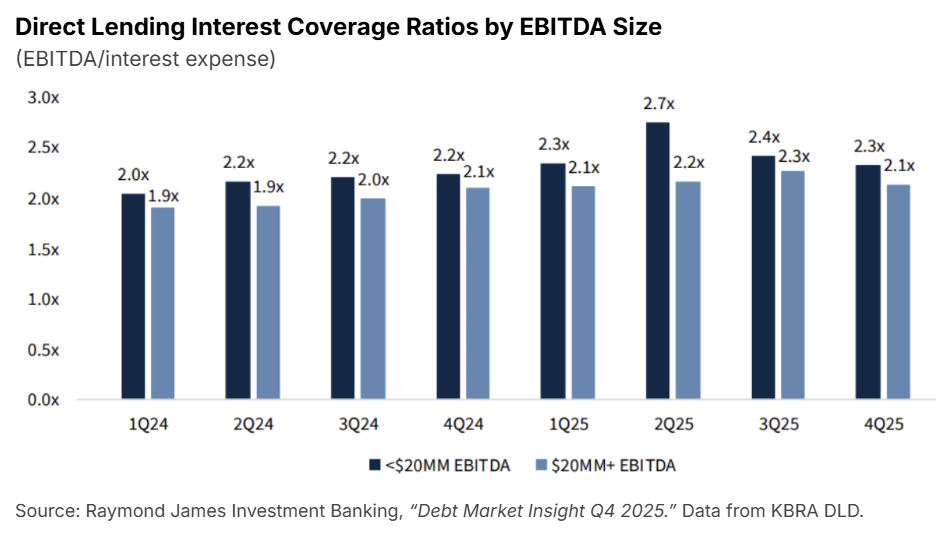
Again, looking at the longer historical context can help assess whether current coverage levels are healthy. The chart below presents interest coverage using the Houlihan Lokey Private Performing Credit Index (PPCI) extending back to 2020. Note that this series is not directly comparable to the one above and should be read independently and directionally rather than in relation to each other. The KBRA data above reflects new direct lending issuance, while the PPCI below covers a broader universe across performing private credit loans, producing meaningfully different absolute levels.
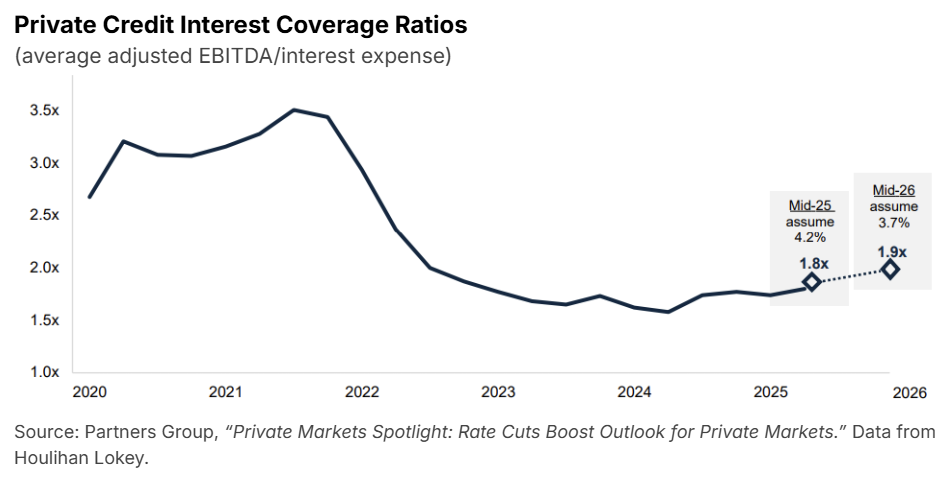
The PPCI shows that interest coverage peaked in 2021 during the low rate environment, then declined sharply due to rate hiking driving borrowing costs higher. Recent rate cuts beginning in late 2024 have led to rising interest coverage, with projections of continued improvements in 2026 (although it may not be perfectly linear). Together, both data sets support the same conclusion that interest coverage has been stable and remains within a historically functional range.
Weighing the competing narratives
So what does this all mean? How does an interested investor, or just a market enthusiast, unpack all of this noise? There are two main polar narratives, and the truth is likely somewhere in between, but closer to which side?
The current media narrative
The private equity sector has created a private credit bubble to boost AUM and generate fee-related earnings.
These loans are poorly underwritten and laden with bad credit that managers blindly fail to mark down.
Tricolor and First Brands are simply the first shots across the bow of bad underwriting and are the “canary in the coal mine.”
Software was formerly the darling of creditors because of the high margins and strong capital structures of previously impregnable companies. Now, with the broader market “SaaSpocalypse,” credit managers have huge swaths of worthless debt on their books.
On top of this, managers have locked investors in with no way out, leaving investor dollars trapped in a bubble of managers’ own making.
The asset manager narrative
There is no bubble. Private credit has grown tremendously but has only taken a larger share of what was formerly bank capital. This is actually better for the economic capital structure. While banks must fulfill depositor capital redemption requests, creating the potential for asset runs, asset managers do not, so you can’t have a “run on the bank.”
Direct private credit exposure to both Tricolor and First Brands was minimal, as both situations primarily impacted bank lenders. Setting that aside, neither event has meaningfully altered the normal cycle of default rates. They were just big headlines. Critically, both failures were driven by fraud, so the potential for contagion is limited.
Credit quality has not actually deteriorated. Over many years of data, there is nothing to suggest credit quality has materially changed. Third-party asset sales have shown the underlying quality of the loans.
Software may yet become problematic, but lenders aren’t seeing stress yet. It would be fair to discount a portion of the loan book for potential forward-looking software stress, but not at the rate some fear. Software actually makes up a smaller portion of most loan books than the headlines suggest.
Investors may not like the redemption structure of these vehicles, but they serve a clear purpose: to prevent fire sales in exactly these circumstances. Investors who want liquidity have the option of publicly traded BDCs or bonds. Those with a longer investment horizon who don’t want to invest at a discount to NAV can invest in interval funds, which have structural gates designed to prevent panic selling of good assets at depressed prices.
Headlines created this hysteria by incorrectly flagging Tricolor and First Brands as private credit failures, which triggered a wave of redemption requests, activating the 5% safety gates, and creating more hysteria in a self-reinforcing cycle.
Managers have put their money where their mouths are. Blackstone senior executives personally committed $150 million of their own capital to help meet BCRED redemptions above the fund’s cap, and Blue Owl’s board approved a $300 million share repurchase program for OBDC (the public BDC) to take advantage of the low share prices.
As noted, the truth is likely somewhere in between. One thing worth considering for the astute observer: if the media narrative is correct, with one analyst calling for 15%+ credit defaults, then private credit is probably the least of our concerns. Credit sits below equity in the capital stack, meaning it is paid back before equity. So if the “private credit meltdown” that many seem eager to be the first to call actually materializes, equity markets will be steamrolled. For context, speculative-grade corporate defaults during the Great Financial Crisis peaked at 13%. Consider what a 15%+ default rate would actually mean for the broader economy.
Put bluntly, we can’t have credit at historically tight spreads, the S&P 500 near all-time highs, and private credit simultaneously imploding. Commentators might argue that this is the “canary” and the collapse is pending, but:
a) BDCs are already priced as though this disaster is here.
b) Asset manager stocks are down 30–50%+ over the past six months, similarly pricing in the worst.
c) It is unusual for a credit implosion to precede any deterioration in equity.
There seems to be a disconnect between where broader markets are trading and what the private credit doom narrative implies.
We will continue to closely monitor these credit indicators and how the industry’s leading alternative asset managers navigate this period of scrutiny. For now, the fundamentals don’t reflect instability, and headlines appear to be mischaracterizing some key concerns. That doesn’t mean underlying stress cannot emerge, so we will audit the signals closely to ensure that current resilience remains a long-term reality.
Download the white paper at the top of this page for the full list of citations.
Long Angle members can reach out to the Long Angle Investments team with any questions on private credit and opportunities to invest. Non-members can learn more about Long Angle at longangle.com and apply for membership here.
Ready to connect with like-minded peers navigating similar wealth decisions?
Join Long Angle, a private community where successful entrepreneurs, executives, and professionals collaborate on wealth strategies, investment opportunities, and life's next chapter.