Private Markets Terminology: Return Metrics & Investment Concepts
The Private Markets Terminology Guide is an introduction for investors newer to private markets. It covers: return metrics (MOIC, IRR, DPI, RVPI, TVPI), parties (GP, LP, QP, SPV), structures (drawdown, evergreen, interval, tender offer, co-investments, syndications), fees (management fee, carried interest, GP catch-up), the investment lifecycle (capital calls, distributions, J-Curve), asset classes, and more.
Access the Full Investment Guide Here
Table of Contents
Return Metrics: MOIC, IRR, DPI, RVPI, TVPI
Parties Involved: GP, LP, Accredited Investor, Qualified Purchaser, SPV
Investment Structures: Fund Types (drawdown, evergreen, interval, tender offer), Co-investments, Syndications, and Fees (management fees, carried interest, GP catch-up)
Investment Lifecycle: Capital calls, Distributions, the J-Curve
Key Concepts: Diversification, Correlation, Illiquidity Premium, Dispersion, Common Critiques of Private Markets
Why This Guide Exists
Private markets have their own vocabulary
If you've ever opened an investment memo and felt like you were reading a foreign language, you're not alone and you're not behind. Terms like MOIC, IRR, DPI, and J-curve appear constantly in investment memos, fund documents, and investment discussions. This guide is designed for investors newer to private markets to use as an educational resource and return to as a quick reference guide when evaluating opportunities. Understanding key terms is the first step in diligence.
The following covers return metrics and investment concepts. For more, see our companion guide: Private Markets Terminology: Asset Classes & Strategies.
Return Metrics
MOIC: Multiple on Invested Capital
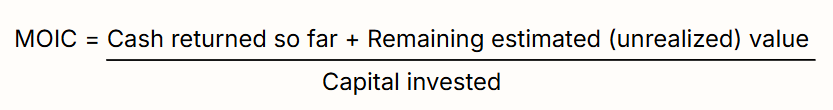
MOIC is the total value returned divided by the total capital invested. It answers the simple question: "How many times did I get my money back?”
1.0x = you got your money back, nothing more
2.0x = you doubled your money
MOIC may include both cash already returned and the current estimated value of what's still held in an active fund, meaning part of the number may be unrealized until the fund winds down.
Note that unrealized value is not cash. MOIC also doesn’t account for time: a 2x MOIC over 5 years is a very different outcome than a 2x MOIC over 15 years.
Net vs. Gross
MOIC and performance in general is quoted two ways. Gross returns are before management fees and profit shares are deducted. Net returns are what you take home after all fees (the actual returns to investors). Always make sure you're comparing funds on a net basis.
IRR: Internal Rate of Return
IRR can be thought of as the annualized growth rate a private investment generates over its lifetime.
It’s similar in concept to compound annual growth rate (CAGR), but goes further by accounting for the time value of money as capital is invested and returned.
What IRR Measures
IRR reflects the timing of cash flows moving in and out of an investment: your initial investment is a cash outflow, and every distribution you receive is a cash inflow. The growth rate that balances those flows over time is the IRR.
A common critique of IRR is that it assumes all dollars can be reinvested at the same rate of return, which rarely happens in reality and can lead to IRR gaming by fund sponsors. MOIC and cash flows can help you get a fuller picture.
Just like with MOIC, it is most useful to compare net IRR across funds with similar vintages (the year they began deploying capital), strategies, and durations.
Reading MOIC and IRR Together
These two metrics answer different questions. MOIC captures how much you made but not the timing of inflows and outflows. IRR reflects how fast capital compounded, but can be misleading when early returns are quick but small in absolute terms.
How Each Metric Can Mislead Without the Other
MOIC Without IRR
Two examples with the same MOIC:
Double your money (MOIC=2x) in 1 year. $1 paid day 1, $2 returned day 365. IRR = 100%
Double your money (MOIC=2x) in 2 years. $1 paid day 1, $2 returned day 730. IRR = 41%
Same MOIC, different outcomes. IRR tells you which investment returned capital faster and compounded more efficiently.
IRR Without MOIC
Example: A short-term real estate bridge loan with a 1% origination fee, 1% prepayment fee, and 2% monthly interest. If fully repaid after one month, that 4% total return produces an impressive-looking 65% IRR. But the MOIC is only 1.04x, not especially attractive if not easily repeatable.
This is how early distributions can inflate a fund’s reported IRR while masking modest absolute gains. MOIC removes that ambiguity.
DPI: Distributed to Paid-In Capital
When a fund reports performance, it breaks down returns into what has actually been paid back and what remains on paper.
DPI is the ratio of cash actually returned to investors (realized value) divided by total capital invested. A 1.0x DPI means the fund has returned your full investment in cash.
RVPI: Residual Value to Paid-In Capital
The manager's current estimated fair market value of investments still held in the fund, not yet returned to investors.
TVPI: Total Value to Paid-In Capital
The ratio of total value (realized + unrealized) divided by total capital invested. TVPI and MOIC are definitionally the same.
DPI + RVPI = TVPI = MOIC
Managers often exclude RVPI from reporting because it can be calculated as TVPI minus DPI. Note that since RVPI and TVPI rely on internal manager marks, they may not reflect actual exit value.
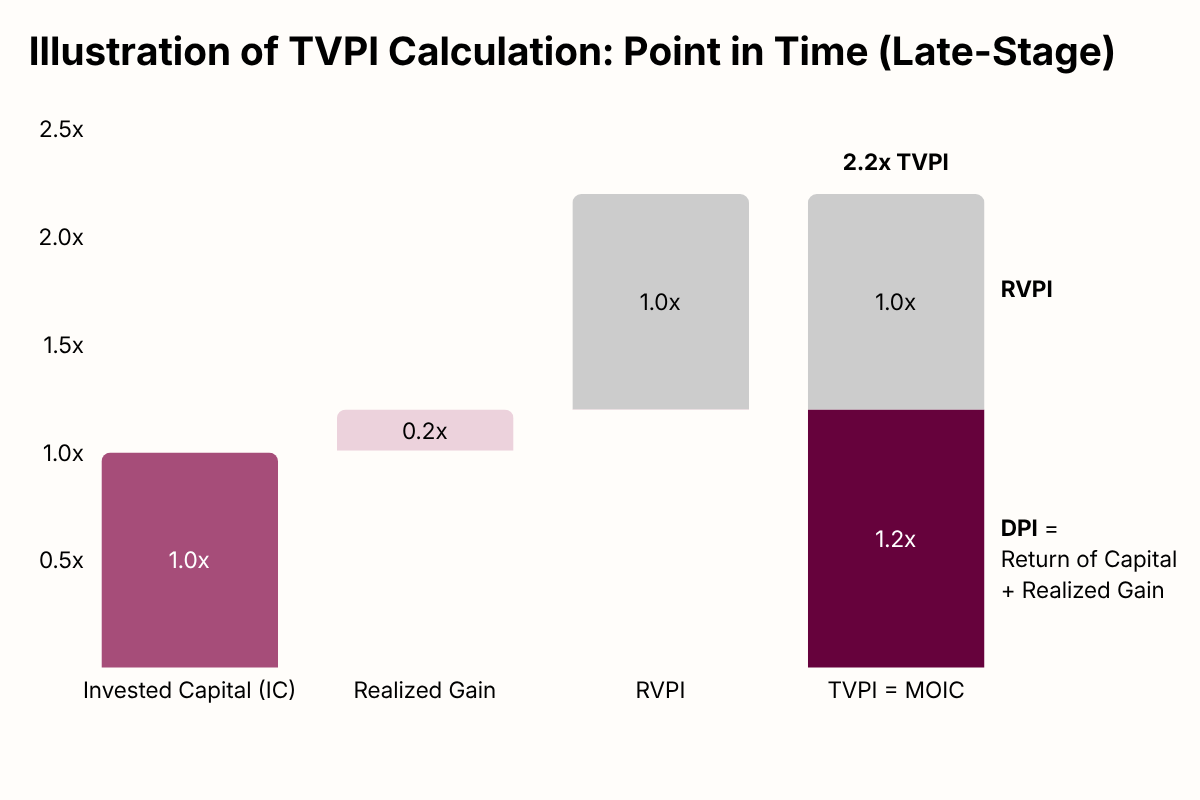
TVPI In Practice: Point in Time
The example below reflects a point in time of a later-stage fund. The fund has returned 1.2x DPI, meaning investors have already received back their full capital (1.0x) plus an additional 0.2x in realized gains through distributions. The fund also holds unrealized investments currently estimated at 1.0x RVPI (per the manager’s valuation). Combined, the total value to investors is 2.2x TVPI, or a 2.2x MOIC.
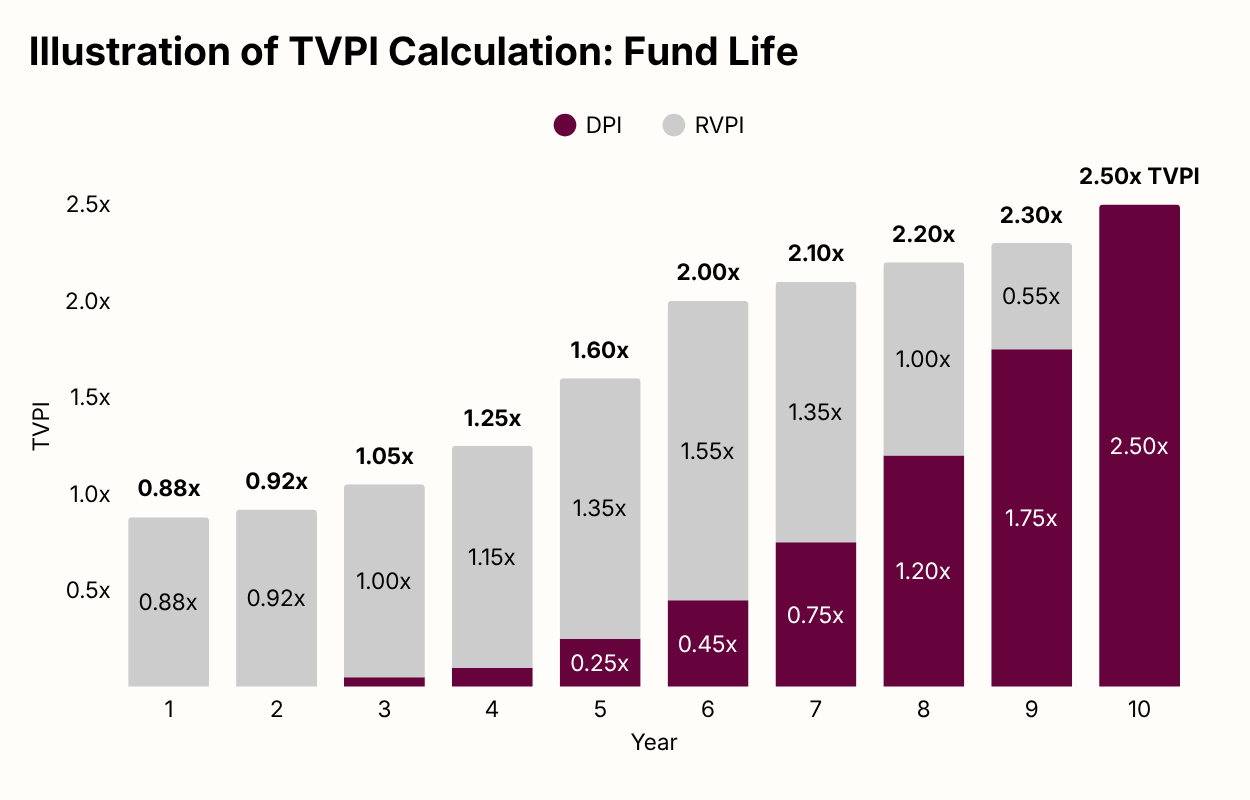
TVPI In Practice: Fund Life
This example shows how DPI, RVPI, and TVPI evolve over a fund's life. TVPI is not fixed. It rises as investments grow in value and falls if they disappoint. Over time, you want to see DPI climb as capital is returned and RVPI shrink as positions are exited.
What do strong return targets look like?
It depends on the strategy and fund duration. These are representative ranges of what well-regarded managers in each category tend to target, based on some of Long Angle’s recent investments.
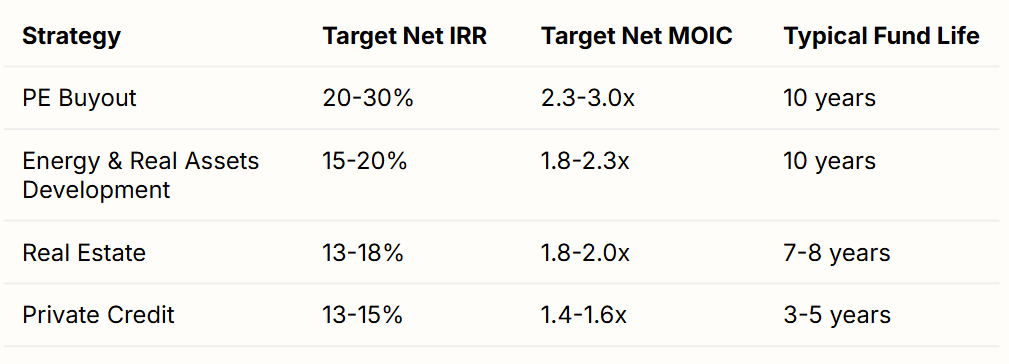
Illustrative ranges, not guaranteed outcomes. Note that target IRRs may not appear to match the fund life and MOIC. One might assume a 25% IRR over 10 years would produce ~9x MOIC, but that assumes full deployment day 1 and a full distribution at 10 years. For a closed-end (drawdown) fund, capital is called gradually over the investment period and returned in stages via distributions, so the compounding period for each dollar is shorter than the full fund life. The timing of inflows and outflows explains the 25% IRR over 10 years producing a 2.5-3x MOIC.
The table reflects return targets only, not risk. Higher returns generally come with higher risk of loss. Always compare figures against funds in the same asset class, vintage year, and on a net basis.
Parties Involved
GP: General Partner
The fund manager responsible for all investment decisions. The GP identifies and evaluates opportunities, negotiates terms, oversees assets during the holding period to create value, and ultimately executes exits to return capital to investors. GPs are often referred to as fund sponsors. They receive management fees, carried interest (see below), and may commit capital to their own funds (the GP commitment).
LP: Limited Partner
You, the investor. LPs contribute their capital into a fund for GPs to deploy.
Accredited Investor vs. Qualified Purchaser (QP)
Both are SEC designations that determine which investment opportunities you can access. Accredited Investor status requires $1M+ net worth (excluding primary residence) or $200K+ annual income. Qualified Purchaser status requires $5M+ in investable assets and unlocks access to a broader set of private funds. The Investment Company Act of 1940 exempts funds from registering as investment companies if they meet one of two criteria: 1) 100 or fewer investors, or 2) funds whose investors are all QPs. This creates a structural constraint for funds that allow Accredited Investors, as fund sizes are effectively capped (e.g., 100 investors × $100K = $10M).
SPV: Special Purpose Vehicle
A standalone legal entity created to hold a single fund investment or private company capital raise. Long Angle uses SPVs to pool member capital into singular investments, allowing members to collectively invest at institutional minimums they couldn't access alone.
Investment Structures
Fund
Most private market investments are structured as funds, where capital is pooled and managed by a GP across multiple investments.
Drawdown (or Closed-End) Fund
A fund with a fixed term (5-10+ years) and a fixed capital raise period. GPs call capital from investors during the investment period, typically the first half of the fund’s life.
Evergreen (or Open-End) Fund
No fixed end date. Capital is deployed upfront rather than called over time, eliminating the cash drag experienced with draw-down funds while waiting for capital calls. Investors can subscribe and redeem periodically (quarterly or semi-annually), subject to fund-level caps. Funds with periodic liquidity features are often referred to as “semi-liquid.”
Evergreen funds must have well-constructed valuation policies so investors can enter and exit fairly based on regularly updated asset values.
Interval Fund
Offers redemptions at set intervals (typically quarterly) up to a fixed percentage of assets. Both interval and tender offer funds are technically closed-end structures despite offering periodic liquidity.
Tender Offer Fund
The GP periodically offers to redeem investor shares at its discretion, controlling the timing and amount. Less predictable for investors than interval funds.
Co-investment
An opportunity to invest alongside a GP in a specific investment, typically offered to existing fund LPs as a relationship benefit. Co-investments are typically offered when a single investment is too large for the fund and the GP needs additional capital to close the deal. They usually come with reduced or no fees, allowing investors to capture more of the return.
Syndication (or Syndicate)
A one-time pooling of capital from multiple investors to fund a single specific investment, rather than a diversified portfolio managed over time. Think of it as a fund with one investment instead of many. Syndicates are similar to co-investments but without an existing fund relationship.
Direct
An investment in a single company or asset sourced independently, without a fund structure or GP intermediary. This is less common for individual investors given the sourcing, diligence, and minimum investment requirements typically involved.
Management Fee
An annual fee charged by the GP to cover operating costs including salaries, due diligence, fund administration, and overhead. These are typically around 2% of committed capital per year, charged regardless of fund performance. On a $100,000 investment, that's $2,000 per year before any returns are generated. After the investment period, fees are often reduced to a percentage of invested capital rather than committed capital.
Carried Interest (Carry)
The GP's performance fee, which is typically 20% of profits above a minimum return threshold called the hurdle rate or preferred return (usually 8%). Carry aligns the GP's incentives with investors: the GP only earns carry after you've been paid back your capital plus the hurdle. If the fund underperforms, the GP earns no carry.
“2 and 20”
Industry shorthand for the standard fee structure: 2% management fee and 20% carry. Not every fund uses exactly these terms, but "2 and 20" is a benchmark. Always check both.
GP Catch-Up Provision
After investors clear the hurdle rate, some funds allow the GP to take 100% of profits temporarily until they've received their full 20% carry on all profits. Once the GP has "caught up," the 80/20 split begins.
Other Fees and Expenses
Private market funds may charge additional fees including transaction fees, acquisition fees, loan guarantee fees, or platform/fund of funds fees. Fund expenses are costs charged to the fund, not paid to the GP, such as third-party services, legal fees, audit, and tax preparation.
Investment Lifecycle
Illustrative example of a private equity drawdown fund
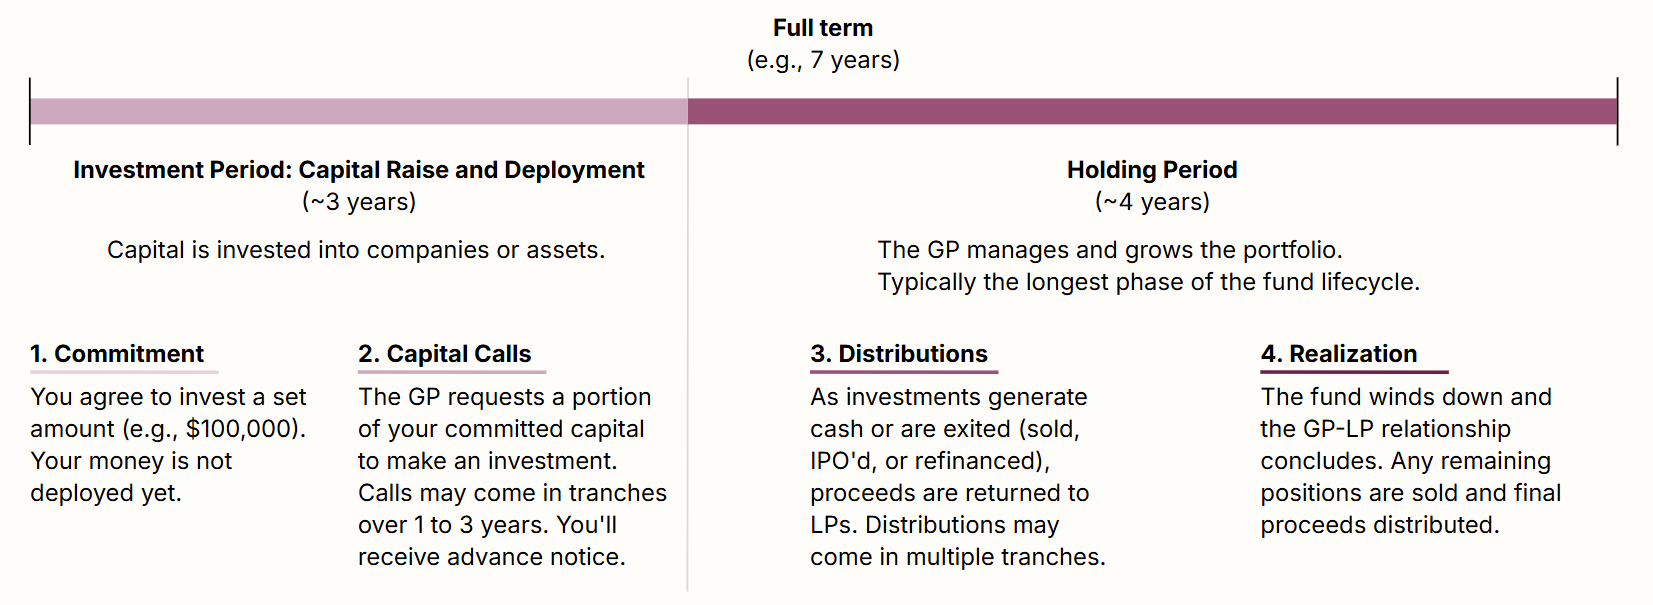
For illustrative purposes only. Timing of capital calls and distributions varies by fund and strategy. Evergreen funds have a different lifecycle.
Investment Period
Capital Raise and Deployment (~3 years). Capital is invested into companies or assets.
Commitment: You agree to invest a set amount (e.g., $100,000). Your money is not deployed yet.
Capital Calls: The GP requests a portion of your committed capital to make an investment. Calls may come in tranches over 1 to 3 years. You'll receive advance notice.
Holding Period
The GP manages and grows the portfolio (~4 years). Typically the longest phase of the fund lifecycle.
Distributions: As investments generate cash or are exited (sold, IPO'd, or refinanced), proceeds are returned to LPs. Distributions may come in multiple tranches.
Realization: The fund winds down and the GP-LP relationship concludes. Any remaining positions are sold and final proceeds distributed.
J-Curve
When you first invest in a private fund, your reported returns will often go negative before they go positive. This is called the J-curve effect, named for the shape the return curve makes: dipping below zero before rising over time.
Why The J-Curve Happens
In the early years, fees and expenses are charged from day one and capital is called while little to nothing is coming back and investments are held at cost (e.g., most PE and VC funds make no distributions until investments are exited). It takes time for those investments to mature and be exited at a gain.
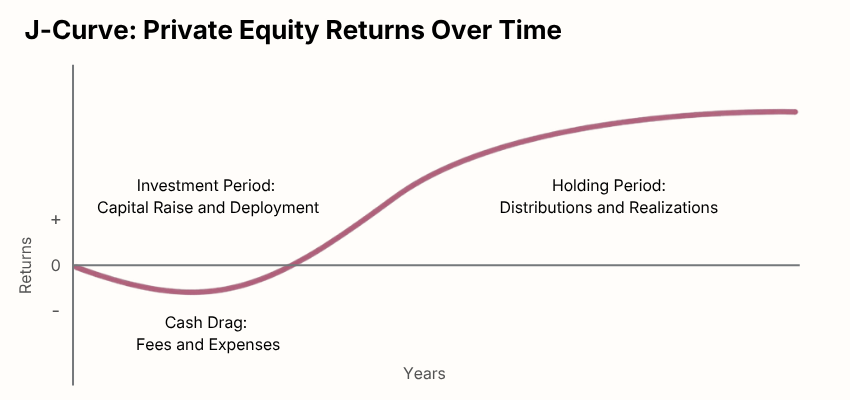
For illustrative purposes only. Investment period and holding period often overlap.
Key Concepts: Return Characteristics
Diversification
The S&P 500 is increasingly concentrated (the top 10 stocks represent a historically large share). Private markets offer exposure to different companies (size and stage), sectors, geographies, and economic drivers to reduce the reliance on public market performance. Private and alternative investments can complement without replacing traditional assets.
Correlation
The degree to which two investments’ performance move in the same direction. A correlation of 1.0 means they move in lockstep; 0 means no relationship; -1.0 means they move in the exact opposite direction. Private asset classes (especially alternatives like litigation finance, music royalties, and infrastructure) tend to have low correlation to public equities, meaning they can hold or gain value when the stock market falls.
Illiquidity Premium
Unlike public stocks, private investments have no liquid market. They are therefore difficult to value and cannot easily be sold. In exchange for accepting that illiquidity, investors expect a premium of higher returns than public comparables. This is a core part of the private markets value proposition. The premium is further supported by how private returns are generated: through actual transactions (e.g., buying and selling real estate), whereas public market entry and exit prices are subject to timing and market volatility.
Dispersion
The range of returns between the best and worst performing managers in a given asset class. In public markets, most managers cluster around the benchmark. In private markets, the gap between a top-quartile and bottom-quartile manager can exceed 20% annually, making manager selection one of the most consequential decisions a private markets investor will make. This is why GP due diligence is so important.
Key Concepts: Common Critiques of Private Markets
Some private investments have high correlation to public markets
Not all private strategies offer true diversification. Late-stage venture and growth equity in particular can become correlated with public technology stocks, especially during market downturns when correlations tend to rise across asset classes and valuation multiples are closely linked.
Bottom-quartile managers underperform public indices
The same manager selection dynamic that produces exceptional top-quartile returns works in the other direction. Poor manager selection can result in returns well below what a simple index fund would have delivered, with less liquidity.
Exposure to bad actors is a real risk without proper vetting
Private markets require less transparency and regulatory scrutiny than public markets. Without proper due diligence, investors can be exposed to managers who misrepresent track records, obscure fee structures, or misuse investor capital. Caveat Emptor.
Fees are higher than public ETFs
A low-cost public ETF charges a fraction of a percent; a private fund charges 2% annually plus 20% of profits. The illiquidity premium must be large enough to overcome those fees and justify the investment.
Common Mistakes by First-Time Investors
Evaluating Opportunities and Managers
Misinterpreting performance: A high IRR can mask modest gains; a strong MOIC can obscure how long capital was tied up. Read them together. Fees and carry reduce gross returns. Isolate net returns to understand after-fee performance expectations.
Overweighting to a small performance sample: Investors should evaluate manager performance across multiple vintages (ideally through a downturn) and against their peers. The gap between top and bottom managers can be substantial.
Underestimating key-person risk: For smaller and mid-market managers especially, returns are often tied to 1-2 individuals. Turnover can alter outcomes meaningfully.
Limited diligence: New investors may be tempted by the first attractive opportunity they see, often via friends and family. Conduct thorough diligence before committing.
Committing and Investing
Not understanding capital calls and cash drag: Capital is called over 3-5 years. Uncalled capital remains with the investor while fees accrue on the full commitment.
Not accounting for tax complexity: K-1 timing, state K-1s, and the need to file annual extensions add administrative burden and cost.
After Committing to an Investment
Misunderstanding unrealized value: Manager valuations are not realizations. Strong interim unrealized performance may not materialize.
Underestimating time horizon and liquidity constraints: Private investments typically take 7–10 years to mature. Drawdown funds should be viewed as having no exits until underlying assets are realized. For evergreens, semi-liquidity should never be treated as readily available due to fund-level redemption caps and GP discretion.
Where To Go From Here
Long Angle members can reach out to the Long Angle Investments team with any questions.
Non-members can learn more about Long Angle at longangle.com and apply for membership here.
See our Private Markets Glossary for a searchable list of private markets terms and definitions.
Ready to connect with like-minded peers navigating similar wealth decisions?
Join Long Angle, a private community where successful entrepreneurs, executives, and professionals collaborate on wealth strategies, investment opportunities, and life's next chapter.