Search Funds: How They Work, Historical Returns, and What to Look for in a Manager
Written By: Chris Bendtsen
A specialized form of small cap private equity. 35.1% aggregate gross IRR and 4.5x gross MOIC since 1984, per Stanford GSB. How the model works, what drives returns, and what to look for in a manager.
2026 High-Net-Worth Asset Allocation Report
See how high-net-worth investors with $2M-$100M+ are allocating across public equities, private markets, real estate, bonds, and cash. Based on benchmark data from 230+ respondents.
A search fund is the vehicle that an individual entrepreneur (the searcher) raises to find a business to acquire. The term “search funds” is also commonly used to refer to the asset class itself. Searchers raise capital individually, through family offices, and often through manager-led funds (pooled vehicles that generally back 10 to 25 individual search funds per vintage). These can be thought of as funds of search funds. Manager-led funds provide LPs with diversified exposure across many searchers in a single commitment and they provide searchers with resources, expertise, and capital to improve the odds of success in their searches.
Search funds are one of the most consistently top-performing corners of private markets. Yet they’re also one of the smallest and least accessible asset classes. The companies acquired often sit below the floor of traditional middle market private equity and access to the best managers is gated by long-standing GP/LP relationships. Given the relatively small size of each fund vintage (typically $50-200M for the larger search funds), most fund vintages finalize fundraises in a single close and mostly the same historical LP rosters.
Search fund returns are typified by a small set of very large winners (typically 8-10x+), a normal distribution of 3-4x returners, and a relatively small subset of failed acquisitions. These return dynamics can mirror venture and growth equity like upside with much less downside risk given the relatively low loss ratios.
Search funds are a specialized form of small cap private equity that backs individual entrepreneurs to acquire small, stable businesses, grow them over 4 to 7 years as owner-CEO, and exit at a higher valuation. Since 1984, the asset class has produced a 35.1% aggregate gross IRR and 4.5x gross MOIC across 681 search funds, per Stanford GSB's 2024 study.
Key Takeaways
Search funds back individual entrepreneurs to acquire small, stable businesses (typically $10 to $50 million enterprise value), grow them as owner-CEO, and exit at institutional-grade multiples.
The asset class has produced a 35.1% aggregate gross IRR and 4.5x gross MOIC since 1984, per Stanford GSB's 2024 study, with no clearly underperforming vintage from 2001 to 2020.
Returns are right-skewed: 63% of search funds completed an acquisition, but 5-10x and 10x+ outcomes mathematically dominate the aggregate IRR.
Manager-led funds, pooled vehicles backing 10 to 25 individual searchers per vintage, are the most analytically sound LP access point, providing diversification across many searchers in a single commitment.
Key evaluation criteria include multi-vintage realized track record with DPI and net MOIC across at least two fully-realized funds, loss ratio methodology clarity, and searcher pipeline quality.
Tax considerations include UBTI (making search funds generally unsuitable for IRAs), multi-state K-1 reporting, and potential QSBS eligibility for a significant portion of portfolio company acquisitions.
How Search Funds Work
The Search Fund Lifecycle
A typical search fund moves through four distinct stages over a roughly 10-year arc:
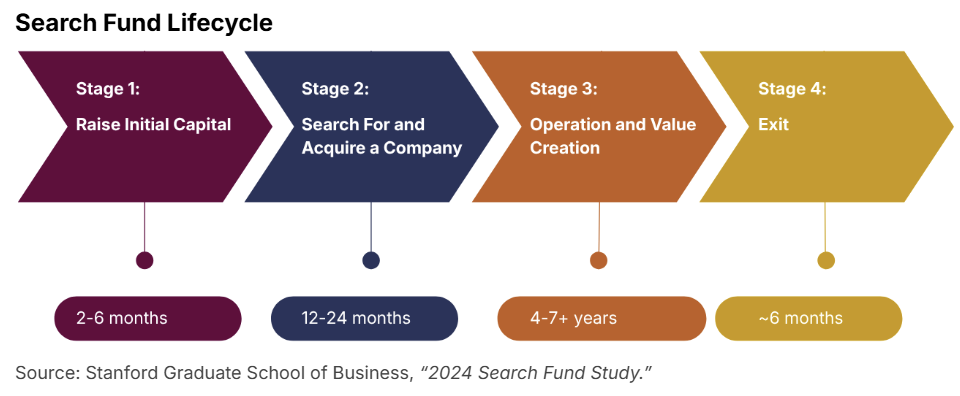
Stage 1: Raise initial capital. 2 to 6 months. A searcher, typically a recent MBA graduate, former consultant, or banker, raises a search fund: several hundred thousand dollars in search capital from a group of backers to fund a salary, travel, due diligence costs, legal fees, and overhead during the search. The cap table usually includes one or more manager-led funds taking the largest positions, alongside individual investors filling out the remainder.
Stage 2: Search for and acquire a company. 12 to 24 months. The searcher screens hundreds of opportunities, signs 3 to 4 letters of intent, and closes one acquisition. Once a target is negotiated, the original backers can invest pro-rata in the much larger acquisition capital, generally on a stepped-up basis to their original investment (see explanation below).
Stage 3: Operation and value creation. 4 to 7+ years. The searcher takes the role of CEO. The manager and other co-investors take board seats and provide oversight and operating support. Value is created through revenue growth, operational improvement, add-on M&A, and multiple expansion.
Stage 4: Exit. ~6 months. Sale to a strategic acquirer, a private equity buyer, or recapitalization, returning capital to investors.
Understanding the Step-Up Basis
The step-up compensates original search-stage backers for the risk of funding a searcher who might not find a deal. When a searcher successfully closes an acquisition, the original capital converts into operating company equity at a stepped-up basis (most commonly 50%). A simple example:
Backer invests $50,000 in search capital.
Searcher closes an acquisition 18 months later.
The $50,000 converts into operating company equity as if the backer had invested $75,000 ($50,000 × 1.5, or a 50% step-up).
The backer also has the option to invest additional acquisition capital at the same terms as the rest of the cap table.
A few nuances worth noting:
The step-up only triggers if a deal closes. There is no step-up on broken searches.
The 50% figure is general practice but the specific number is negotiated between the searcher and the original backers when the search fund is formed.
Initial backers can typically exit the search at around 1.5x should they choose not to participate in the acquisition.
The Searcher and the Manager
Searchers are often graduates of top MBA programs. Common backgrounds include investment banking, management consulting, and private equity.
One common critique of search funds is that investors are betting on inexperienced first-time CEOs. The industry's three-decade aggregate returns speak to the model's resilience, but it is fair to note that searchers are by design first-time operators. This is why manager quality matters so much in this asset class. The best managers spend extensive time on searcher selection and provide intensive operational support post-acquisition.
Types of Search Funds
Traditional Search Funds:
An independent searcher raises capital from a group of 10 to 20 backers, typically a mix of manager-led funds (taking the largest positions) and individual investors. The searcher then assembles a similar group, augmented by additional capital, for the much larger acquisition. This is the model Stanford's biennial study tracks, and the model with the longest performance history.
Manager-led funds raise capital from LPs to back many individual search funds. The manager takes a lead investor position on each searcher's cap table (~15% to 25% ownership), serves on the board, and provides operational support. For LPs, this structure delivers diversification across many searches in a single commitment. It also provides professional underwriting and oversight, and access to top-tier searchers.
Other Variations:
Self-funded search: The searcher does not raise external capital and instead funds living expenses personally, often supplemented by Small Business Administration (SBA) backed debt at acquisition. Target companies are typically smaller, debt loads are higher, and the searcher retains a larger equity stake post-acquisition. Generally not directly accessible to outside LPs.
Single-investor and accelerator models: A single family office, search-focused firm, or accelerator finances the entire search and acquisition. Access is limited to the investors backing the specific firm.
Long-term hold vehicles: A larger committed capital pool is raised at the outset to acquire one or several companies and hold them for 10 to 20 years or more. Less liquid and earlier in performance history than traditional search.
The remainder of this guide focuses on the traditional model.
Target Company Profile
Managers tend to screen for certain financial and operational characteristics. The table below is a typical target profile, drawing on Stanford's 2024 Search Fund Study and Long Angle's diligence experience across the leading managers in the space.
Search Funds Target Company Profile
| Criteria | Manager Screen | Stanford Study Data |
|---|---|---|
| Enterprise value | $10 to $50M | $14.4M median |
| EBITDA | $1 to $5M | $2.2M median |
| EBITDA margins | Varies by manager | 27% median |
| Revenue growth | 10% to 30% LTM | 25% median |
| Entry multiples | 5 to 8x EBITDA / 3 to 5x ARR | 7.0x EBITDA median |
| Recurring revenue | Often preferred; some require 60%+ | 66% of companies have 65%+ recurring |
| Profitability history | 3+ years | — |
| Company maturity | 5+ years operating | — |
| Equity check size | $3 to $10M | — |
Sources: Long Angle Investments diligence across multiple manager-led fund relationships; Stanford Graduate School of Business, “2024 Search Fund Study”
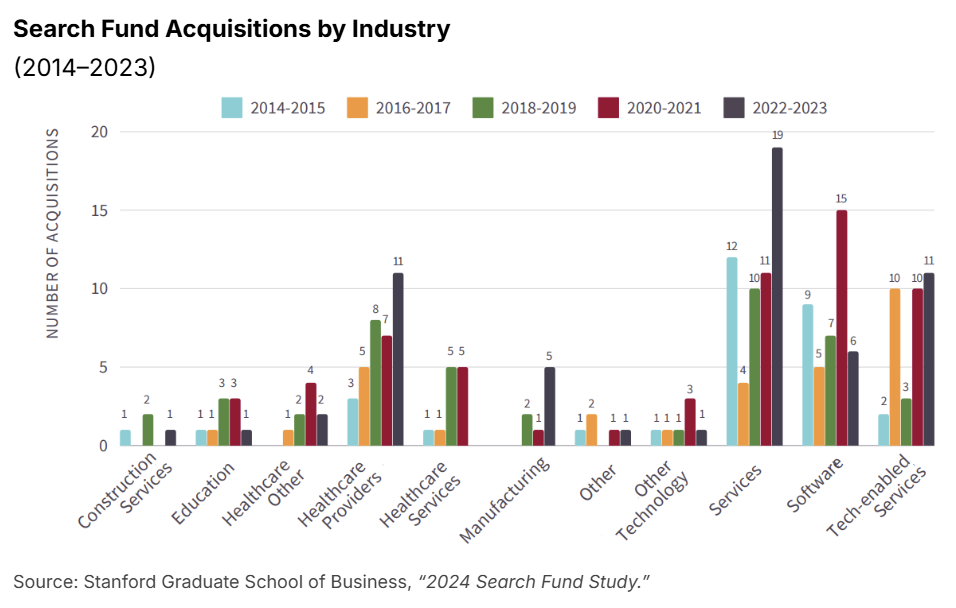
Manager-led funds commonly target B2B services, healthcare, and software businesses within stable end markets not subject to rapid technological or regulatory change (see Stanford’s industry breakdown below). Targets are often founder-owned or owner-operated sellers seeking succession.
Beyond Wealth Newsletter
Weekly perspectives on money, meaning, and the decisions that come after the financial ones get easier. Read by founders, executives, and investors navigating the same questions covered in this post.
Why Invest in Search Funds
Search funds combine several investment characteristics that are rare to find in combination elsewhere in public or private markets:
Attractive entry valuations
Fast-growing, profitable target companies
Multiple paths to value creation
Access to an inefficient market
Macro tailwind: a generational succession wave
Low correlation to public equities
Tax efficiency: QSBS eligibility
Attractive Entry Valuations
Stanford's 2024 study reports a historical entry multiple range of roughly 5x to 7.5x EBITDA for search fund acquisitions going back to 2006. This is broadly in line with multiples paid in lower middle market private equity (see table below), and compares favorably to broader PE buyouts. According to PitchBook’s 2025 Annual US PE Breakdown report, the median US PE buyout transacted at 12.0x EV/EBITDA in 2025, with a historical range of 9x to 14x over the past decade. 5 The gap reflects a structural advantage: search fund target companies sit below the floor of institutional private equity, rarely run through formal broker-led sale processes, and are often sold by retiring owners who care as much about succession and legacy as they do about maximizing price.
Fast-Growing, Profitable Target Companies
Where search funds differentiate from lower middle market PE is on the quality of the companies acquired. Search fund acquisitions are, on average, both faster-growing and more profitable.
Entry Multiples: Search Funds vs. Private Equity
| Entry Multiple | Search Funds (median) | Lower Middle Market PE (average / range) |
|---|---|---|
| Entry multiple | 7.0x EBITDA | 7.2 – 7.5x EBITDA |
| Revenue growth at entry | 25% | ~12-16% |
| EBITDA margins at entry | 27% | ~21% |
Sources: Search Funds: Stanford Graduate School of Business, “2024 Search Fund Study.” Lower Middle Market PE: GF Data, 2025 reports on PE transactions $10M-$500M TEV.
The combination of buying high-quality companies at lower middle market prices and exiting at mid-cap multiples is the core of the search fund return engine.
Multiple Paths to Value Creation
Search fund returns come from four reinforcing levers:
Organic revenue growth: Many targets are underinvested in sales, marketing, and digital infrastructure. A motivated owner-CEO can generate substantial top-line growth.
Operational improvement: Pricing optimization, sales team professionalization, CRM implementation, financial reporting upgrades, and process improvement.
Add-on M&A: Most search fund targets sit in fragmented industries with many small competitors. Buying these smaller players (known as "tuck-in" or "add-on" acquisitions) at lower multiples than the original acquired company increases the overall value.
Multiple expansion at exit: Search fund acquisitions enter at lower middle market multiples and ideally exit at mid-cap multiples after years of growth and professionalization. Once a business reaches institutional size thresholds (~$10 to 15 million of EBITDA), it can attract strategic acquirers and private equity firms that pay premium multiples.
Access to Inefficient Markets
Sub-$50 million enterprise value businesses are too small for the major private equity firms to underwrite economically. Sellers can be unsophisticated about valuation and process, and most acquisitions are sourced directly through proprietary outreach, referrals, and the searcher's network rather than through competitive auctions. This is one of the few segments of private markets where price discovery is inefficient in favor of disciplined buyers.
Macro Tailwind: A Generational Succession Wave
The pool of available sellers is large and growing. According to a 2026 McKinsey Institute for Economic Mobility report, roughly 6 million US small and medium-sized businesses are expected to face ownership transitions by 2035, representing up to $5 trillion in enterprise value as the baby boomer generation retires. More than 1 million of these are expected to be viable candidates for sale. Today, only about 5% of small business exits occur through a sale to a new owner. A smaller percentage transfer to family members, and the rest (90%+) end in closure.
Sellers often prefer searcher-led buyers. A searcher will personally run the company, preserving culture and team in a way a PE firm installing professional management typically won’t.
Low Correlation to Public Equities
Search funds offer a source of diversification for high-net-worth portfolios. Search fund portfolio companies are small, privately held businesses that operate largely independent of public market cycles. A few characteristics support this:
Lower sensitivity to public market beta: A regional commercial HVAC servicer or a SaaS platform serving dental practices is driven by demand patterns specific to its niche, not the broader forces that move public equity indices.
Small, founder-owned private businesses are not priced by markets: Entry valuations are negotiated directly with retiring owners, not set by public market sentiment. A small business sale negotiated over six months doesn't move with the S&P 500.
Customer concentration in essential B2B services: Most search fund portfolio companies sell B2B services that their customers need to operate (e.g., waste management, IT services, specialty distribution, niche software, healthcare back-office). These businesses tend to weather recessions well.
Tax Efficiency: QSBS Eligibility
Because most target companies are small, US-based, and acquired through a C-corporation structure, a significant portion of search fund investments can qualify for Section 1202 Qualified Small Business Stock (QSBS) treatment. For eligible US investors, this can mean a 100% exclusion of federal capital gains tax on the qualifying portion of the exit, subject to limits.
Under the One Big Beautiful Bill Act (OBBA) passed in July 2025, the exclusion cap was raised to the greater of $15 million per investor per company or 10x the investor's adjusted basis in the stock. For example, an investor who put $5 million into a single company could potentially exclude $50 million of gain. Since this exclusion is per investor per company, an investor holding QSBS in multiple qualifying companies can claim the full exclusion separately for each. For search fund LPs holding indirect interests across many portfolio companies, this can compound meaningfully.
Search fund acquisitions are well-suited for QSBS treatment for several reasons:
Company size: Search fund targets typically have enterprise values of $10 to $50 million and aggregate gross assets well below the QSBS ceiling of $75 million.
Industry mix: Many of the target industries (business services, software) qualify as active trades or businesses under Section 1202.
Holding period: Search fund holds of 5 to 10 years align well with the 5-year holding period requirement for 100% QSBS exclusion. Post-OBBBA, a graduated structure now allows for partial exclusion at shorter holds: 50% at 3 years, 75% at 4 years, and 100% at 5+ years.
C-corp structuring: Top-tier managers programmatically structure portfolio company acquisitions as C-corporations specifically to capture QSBS benefits. Some managers report that 50% or more of their portfolio companies potentially qualify.
QSBS eligibility is not automatic. Many target companies are LLCs or S-corps before acquisition, and the C-corp clock starts only after conversion. Some search fund sectors may be excluded or require tax counsel review under Section 1202's active business requirements. For investors holding through a pooled fund or SPV, eligibility depends on pass-through timing and investor-level facts.
For a deeper look at the tax mechanics of private market investing, readLong Angle's Private Markets Tax Guide.
Search Fund Historical Performance
Search funds have one of the most thoroughly documented return histories in private markets, thanks to Stanford GSB's biennial study covering all search funds raised in the US and Canada since 1984. Below we present the headline numbers, the underlying distribution of outcomes, and findings from the Yale School of Management that explain what drives individual investor returns.
Stanford Benchmark
As of December 31, 2023, the 2024 Stanford Search Fund Study reports the following aggregate returns across all 681 search funds raised since 1984 in the US and Canada:
Aggregate Search Fund Returns 1984–2023
| Metric | Returns |
|---|---|
| IRR | 35.1% |
| MOIC | 4.5x |
Source: Stanford Graduate School of Business, “2024 Search Fund Study.”
See Long Angle’s Private Markets Terminology Guide for a full breakdown of IRR, MOIC, and more return metrics.
Even excluding the top 5 outlier performers across the 40-year dataset, aggregate IRR has risen from 20.0% in the 2011 study to 33.0% in the 2024 study (the teal bars in the figure below), suggesting performance has been broadening across more managers and vintages rather than concentrating in a few large winners. These are exceptional numbers by any private markets standard.
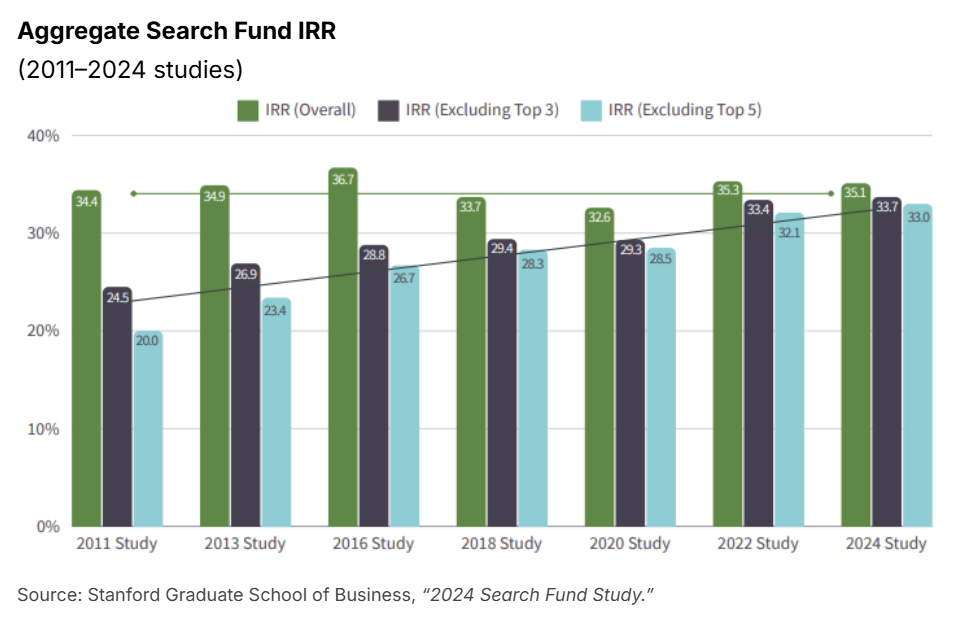
Note: each bar represents aggregate IRR across all search funds in the Stanford dataset as of that study year, not the returns of a single vintage.
Vintage-Level Performance
The Stanford study groups search fund-acquired companies by the year of acquisition and presents the IRR and ROI (i.e. MOIC) of each cohort. The chart below shows performance by vintage for successful searches (searchers that didn’t make an acquisition are not included (~37%)).
The most important takeaway is consistency: from 2001 to 2020, vintage-level IRRs (green line in the chart below) have ranged from roughly 25% to 50% on acquired companies, with ROIs (red line) ranging from about 4x to 6x. The asset class has yet to produce a clearly underperforming vintage.
It is important to note that the two most recent cohorts (2017-2020 and 2021-2022) show a visual decline in return figures. This does not reflect deteriorating performance, as only 3-44% of the companies in those cohorts have reached maturity/terminal exit.

The 2017–2020 and 2021–2022 cohorts are still within the classic “J-curve,” where interim remain muted before rising as the portfolio matures. In the search fund model, initial search capital and early growth investments represent immediate cash outflows incurred well before any offsetting returns are realized. After acquisition, portfolio companies need time to grow revenues, improve operations, and reach the scale that attracts institutional buyers at strong exit multiples. The result is that these younger cohorts show current returns that look depressed relative to ultimate maturity. The 2009–2016 cohorts, now largely or fully exited, illustrate the elevated ROI (MOIC) levels that the 2017–2022 cohorts are tracking toward.
Right-Tail Distribution
The 35.1% aggregate IRR from the Stanford study is generated across a population of 681 search funds:
63% made an acquisition and 37% did not (search-stage capital lost).
Of the 63% that acquired, 31% are in a loss state (already exited or still operating).
Therefore, ~44% of backed search entrepreneurs report positive-returns.
So how does the asset class produce a 35.1% aggregate IRR when fewer than half of search funds return >1x capital? Because the winners are very large and the losers lose limited capital.
Stanford's outcome tree below maps the full distribution, with gains in green and losses in red. Note the share of search funds with 5-10x and >10x multiples in the gains branch and recall that failed searches require minimal capital (to fund a search, not a failed acquisition).
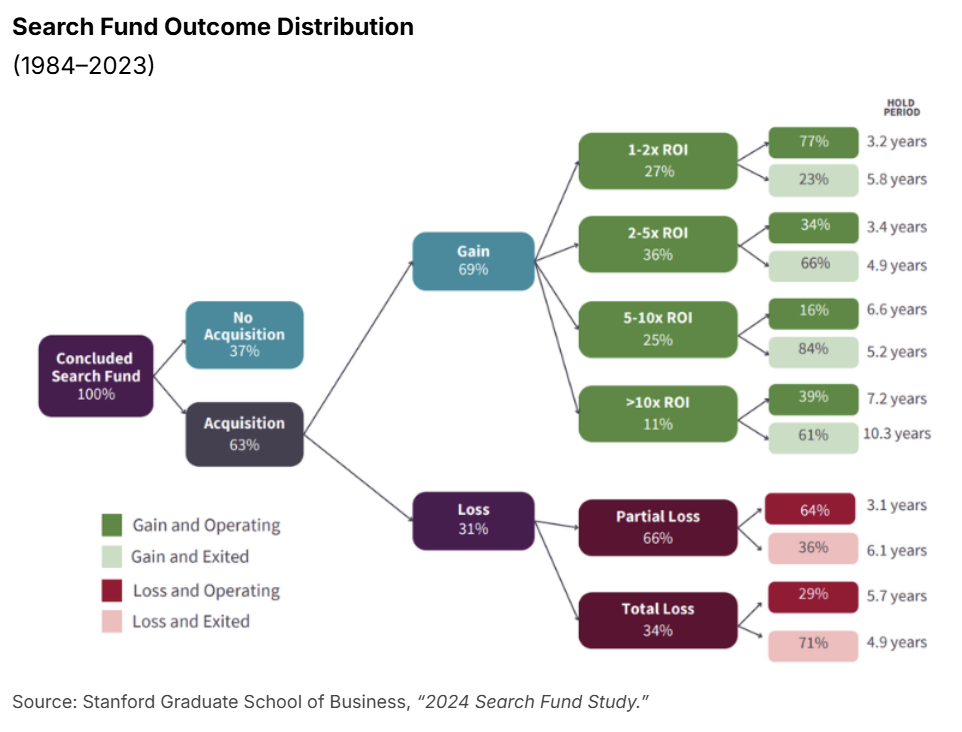
The 5-10x and 10x+ outcomes (roughly 36% of acquisitions, or 23% of all concluded search funds) mathematically dominate the aggregate IRR calculation. This distribution is why manager-led funds are the most analytically sound LP access point for the asset class. A single search fund has less than a 50/50 chance of generating a positive return, but a pooled fund backing many search funds is far more likely to catch one or more of the winners that drive aggregate returns.
Portfolio-Level Evidence from Yale
The Yale School of Management published a working paper in 2025 analyzing the performance of 23 23 manager-led funds and 1,192 individual search funds. While Yale's study is not directly comparable to Stanford's due to methodological differences, Yale's central observation is that manager portfolios tend to underperform the Stanford aggregate (e.g., 2.5x MOIC vs. 4.5x), which reflects the entire search fund universe rather than any single portfolio.
Yale's data confirms the right-skewed distribution of search fund performance when accounting for the initial failed searches because Yale’s dataset includes broken searches and unrealized positions.
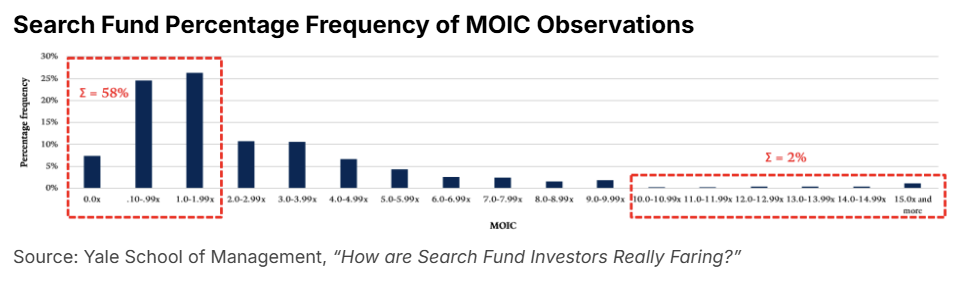
This distribution is what separates top-quartile from median managers. The next section covers how to identify managers best positioned to capture the right tail.
Where do LPs compare notes on private market managers? What the diligence shows, whether the terms are worth it, and what they’re deciding?
Long Angle is a vetted community where members have committed $440M+ across private market offerings, including multiple search fund manager-led vehicles. The investment team posts independent diligence on institutional-grade opportunities. Members see all the analysis and discuss in the forum.
How to Evaluate Search Fund Managers
Multi-Vintage Realized Track Record
Most credible managers have been investing in the strategy for at least 10 years. Look for realized DPI (distributed to paid-in capital) and net MOIC across at least two fully-realized prior funds to evaluate their ability to deliver and exit; not just paper marks on a current fund. Many newer search managers are still entirely in the J-curve with negative initial returns or based entirely on unrealized positions driven by their valuation methodology.
Loss Ratio and Underwriting Discipline
The Stanford 2024 study reports an industry-average loss ratio of approximately 31% of acquired companies experiencing some level of capital loss. When examining a manager’s loss ratio, clarify the methodology. Count-based loss rates, dollar-weighted loss rates, realized losses, unrealized sub-1x marks, and broken searches can tell different stories. A lower dollar-weighted loss rate can be a strong signal, but only if the numerator, denominator, and treatment of unrealized marks are clear.
GP Commitment
Managers who invest significant capital alongside LPs are usually more aligned with their investors. Both the percentage of fund size and the absolute dollar amount matter. Private equity GP commitments are around 1% to 5%; search managers tend to commit at the higher end of this range or above, reflecting the asset class's reputation-driven, hands-on nature. Ask managers what their commitment is and compare historically.
Searcher Selection and Pipeline Quality
Strong manager returns begin with searcher selection. Top managers evaluate hundreds of candidates per year and back only a small fraction (~5 to 10%). They draw from the top MBA programs (HBS, Stanford, Wharton, etc.) and develop relationships with searchers months in advance of committing capital. When evaluating a manager, ask them to point to evidence of searcher quality and their reputation among high-performing searchers.
The best managers regularly co-invest alongside each other on the highest-conviction searchers and deals. A manager who consistently appears on cap tables alongside the small handful of top firms signals peer endorsement. Widely recognized managers include Pacific Lake Partners, Trilogy Search Partners, Peterson Search Partners, Anacapa Partners, Search Fund Partners, WSC & Company, Housatonic Partners, Miramar Equity Partners, TTCER Partners, and Aspect Investors (not an exhaustive list).
Operational Support Bench
Acquired companies are small and run by first-time CEOs. The quality of the manager’s support is an important differentiator. This includes:
Fractional executive bench (HR, finance, M&A, sales, IT) available to portfolio CEOs.
Active board involvement from partners or principals.
Institutional infrastructure for sourcing add-on M&A across the portfolio.
Risks and Considerations
Broken Search
Roughly 37% of search funds conclude without an acquisition according to the Stanford study. The search capital is effectively lost in those cases. This is a real risk, but a contained one since the search capital is small relative to the acquisition capital (~$500K per searcher vs. 2-$5M per acquisition).
First-Time CEO Execution
Searchers are, by design, first-time operators. Most are running their first company in their early- to mid- thirties with limited operational experience. CEO/business fit is a common cause of failure, and the quality of manager support can be the differentiator.
Power-Law-Skewed Return Distribution
As detailed in the Historical Performance section above, search fund returns are right-skewed. An investor whose portfolio misses the few outsized winners in a vintage will earn below the asset class aggregate.
J-Curve and Illiquidity
Search funds are highly illiquid multi-year vehicles that could span a decade or more. Capital is called slowly over 2 to 3 years and material distributions don’t arrive until year 5 or later. The J-curve is more pronounced than in traditional PE because the search period prior to acquisition is all costs, and portfolio companies then need time to grow into their exit multiples.
Software Concentration and AI Disruption
Search fund portfolios have historically allocated about 20-30% of their portfolio to vertical software businesses, which have become more risky recently as AI-driven disruption pressures incumbent SaaS businesses. Investors should ask managers how they are screening software targets for AI vulnerability and how they are pricing it into entry and exit multiples.
Tax Complexity, UBTI, and ECI
Tax treatment: LP tax reporting is complex. The character of income depends on structure, operating income, debt, state allocations, and pass-through treatment. It is often treated as long-term capital gains from exits, with some as ordinary income during the hold period.
K-1s: LPs receive a federal K-1 plus state K-1s for each state in which portfolio companies operate. It is not unusual for an LP in a diversified search fund to receive 15 to 25 state K-1s annually, though often without filing requirements. Delivery tends to fall in the summer, often requiring filing extensions.
UBTI: Search funds can generate UBTI (unrelated business taxable income) because portfolio companies are leveraged US operating businesses. UBTI makes search funds generally unsuitable for tax-exempt accounts such as IRAs and endowments.
ECI: Search funds may also generate ECI (effectively connected income), which creates US tax filing and withholding requirements for non-US LPs. Most manager-led funds don’t offer offshore feeder funds.
Frequently Asked Questions
What is a search fund?
A search fund is a vehicle that an individual entrepreneur raises to find and acquire a small, stable business. The searcher raises initial capital from a group of backers, uses it to fund a search lasting 12 to 24 months, and upon closing an acquisition, takes the role of CEO. The term "search funds" also refers to the asset class itself.
How do search funds work for investors?
Investors back a searcher at two stages: the search and the acquisition. Search capital funds the searcher's salary, travel, and due diligence costs during the search period. When the searcher closes an acquisition, original backers can invest pro-rata in the much larger acquisition capital, typically on a stepped-up basis. Manager-led funds pool LP capital to back many individual searchers per vintage, providing diversification across multiple searches in a single commitment.
What are typical search fund returns?
Since 1984, the asset class has produced a 35.1% aggregate gross IRR and 4.5x gross MOIC across 681 search funds, per Stanford GSB's 2024 study. Returns are right-skewed: fewer than half of all search funds return more than 1x capital, but 5-10x and 10x+ outcomes mathematically dominate the aggregate IRR.
What is a manager-led search fund?
A manager-led fund is a pooled vehicle that raises capital from LPs to back 10 to 25 individual search funds per vintage. The manager takes a lead investor position on each searcher's cap table, serves on the board, and provides operational support post-acquisition. For LPs, the structure delivers diversification across many searches in a single commitment and provides professional underwriting and oversight.
What is the step-up basis in a search fund?
The step-up compensates original search-stage backers for the risk of funding a searcher who might not find a deal. When a searcher successfully closes an acquisition, the original search capital converts into operating company equity at a stepped-up basis, most commonly 50%. A backer who invested $50,000 in search capital converts that into equity as if they had invested $75,000. The step-up only triggers if a deal closes.
Do search funds generate UBTI?
Yes. Search funds can generate unrelated business taxable income because portfolio companies are leveraged US operating businesses. UBTI makes search funds generally unsuitable for tax-exempt accounts such as IRAs and endowments. LPs should confirm UBTI treatment with their tax advisor before investing.
Are search funds eligible for QSBS treatment?
A significant portion of search fund investments can qualify for Section 1202 Qualified Small Business Stock treatment because most target companies are small, US-based, and acquired through a C-corporation structure. Under the One Big Beautiful Bill Act passed in July 2025, the exclusion cap was raised to the greater of $15 million per investor per company or 10x the investor's adjusted basis. Eligibility is not automatic: many targets are LLCs or S-corps before acquisition, and the C-corp clock starts only after conversion. Confirm eligibility with tax counsel.
How do search funds compare to private equity?
Search funds acquire companies at similar entry multiples to lower middle market private equity, but target companies that are faster-growing and more profitable at entry. The key structural difference is that a motivated owner-CEO runs the acquired company, creating value through organic growth, operational improvement, and add-on M&A rather than financial engineering. The combination of buying high-quality companies at lower middle market prices and exiting at mid-cap multiples is the core of the search fund return engine.
Final Thoughts
For investors with access to high-quality managers, search funds can offer exposure to small, profitable businesses, idiosyncratic return drivers, and potential tax benefits. The asset class does, however, require patience, manager selectivity, and comfort with K-1 tax reporting. Long Angle members can review full investment memos and diligence materials for search fund offerings in the Long Angle Investments Diligence Room.
Reach out to the Long Angle Investments team with any questions on search funds and opportunities to invest.
Most financial decisions at this stage are made without anyone to compare notes with.
Long Angle is a vetted community of 8,000+ founders, executives, and investors who discuss private markets allocations, manager relationships, tax strategy, and the full complexity of wealth at this stage, with their real names attached and no one in the room trying to sell them anything.
More From Long Angle
Beyond Wealth Newsletter
Long Angle's free weekly newsletter covering wealth management, investing and life at the intersection of money and ambition. Subscribe »
Navigating Wealth Podcast
The Long Angle podcast. Founders and executives on the financial and personal decisions that actually matter. Listen »