Written by Chris Bendtsen

Private Infrastructure Investing: A Guide to the Asset Class
Private Infrastructure Investing: A Guide to the Asset Class
A Long Angle Investments guide. Covers private infrastructure strategies, historical performance, return drivers, risks, and manager evaluation criteria.
Chris Bendtsen
Private infrastructure investing is the ownership of physical assets that provide essential services to people and economies: power generation, transportation, water, digital networks, and related facilities. Private infrastructure funds generate stable, long-term contracted or regulated cash flows. The asset class delivered roughly 9–10% annualized returns over the past decade, carries a 10-year Sharpe ratio of 1.57, a correlation under 0.2 to a 60/40 portfolio, and generated positive returns during the ten worst equity quarters between 2013 and 2023.
Key Takeaways
- Private infrastructure covers six sectors: power and utilities, midstream and energy, transportation and logistics, digital infrastructure, water and waste, and environmental/decarbonization.
- Strategies range from core (6–8% target net IRR, bond-like income) to opportunistic (12–16%, private equity-like risk), with infrastructure debt as an additional lower-risk option.
- Private infrastructure has a 10-year Sharpe ratio of 1.57, nearly double the S&P 500 at 0.82, and outpaced all major asset classes except large-cap US equities and private equity over the past decade.
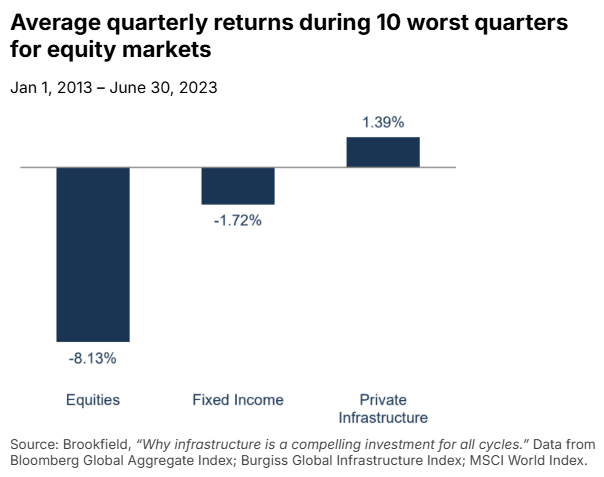
- Infrastructure delivered +1.39% average quarterly returns during the ten worst equity quarters from 2013 through H1 2023, while equities fell 8.13% and fixed income fell 1.72%.
- Built-in inflation protection comes from CPI escalators in most long-term contracts and monopolistic pricing power for regulated assets.
- Manager selection is critical: the gap between top-quartile and bottom-quartile infrastructure managers is significant across all private asset classes.
2026 High-Net-Worth Asset Allocation Report
See how high-net-worth investors with an average net worth of $17M are allocating across public equities, private markets, real estate, bonds and cash. Based on benchmark data from 230+ respondents.

Introduction
Infrastructure investing is the ownership of physical assets that provide essential services to people and economies. These include power generation and transmission, transportation, water, communications, digital infrastructure such as data centers and fiber networks, and social facilities like hospitals. Infrastructure investments typically generate stable, long-term contracted or regulated cash flows, making them an income-focused allocation that is resilient through economic cycles.
Infrastructure's most distinctive benefits for investors include:
- Low correlation to public markets
- Attractive risk-adjusted returns
- Downside protection
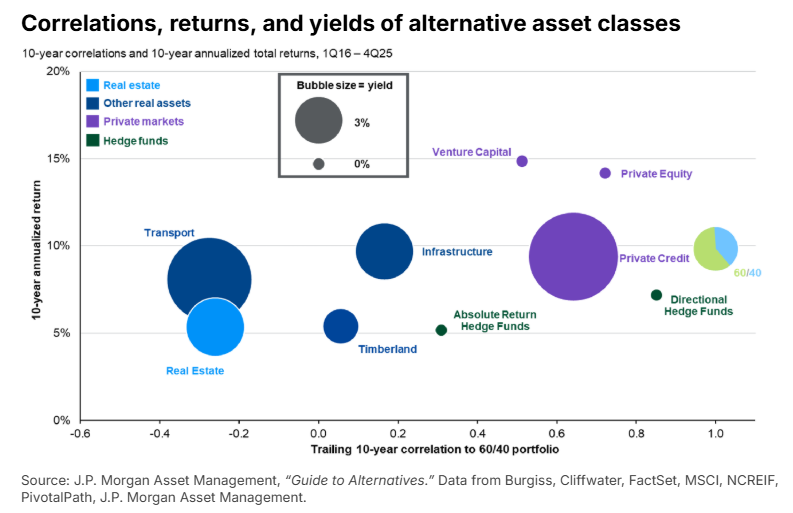
The chart below plots major asset classes on three dimensions: correlation to a traditional 60/40 portfolio (x-axis), 10-year annualized return (y-axis), and yield (bubble size). Infrastructure's low correlation combined with roughly 10% annualized returns and a significant yield component make the asset class worth considering for any portfolio.
Infrastructure has grown from a niche exposure when the first dedicated funds launched in the 1990s, to a core institutional allocation today. Total private infrastructure AUM has reached over $1.5 trillion as of 2025.
Infrastructure Strategies
The infrastructure asset class is typically split into two categories:
- Economic infrastructure: assets where users pay directly for the service, whether via toll, tariff, or usage fee. Includes airports, toll roads, power plants, cell towers, and pipelines.
- Social infrastructure: assets that provide public goods funded via taxes or government payments: hospitals, schools, courthouses, and defense facilities.
Private capital targets economic infrastructure almost exclusively. The addressable market is larger and contract structures make cash flows more transparent. Private infrastructure funds are classified across five dimensions: sector, stage of development, strategy, revenue framework, and fund size.
Infrastructure Sectors
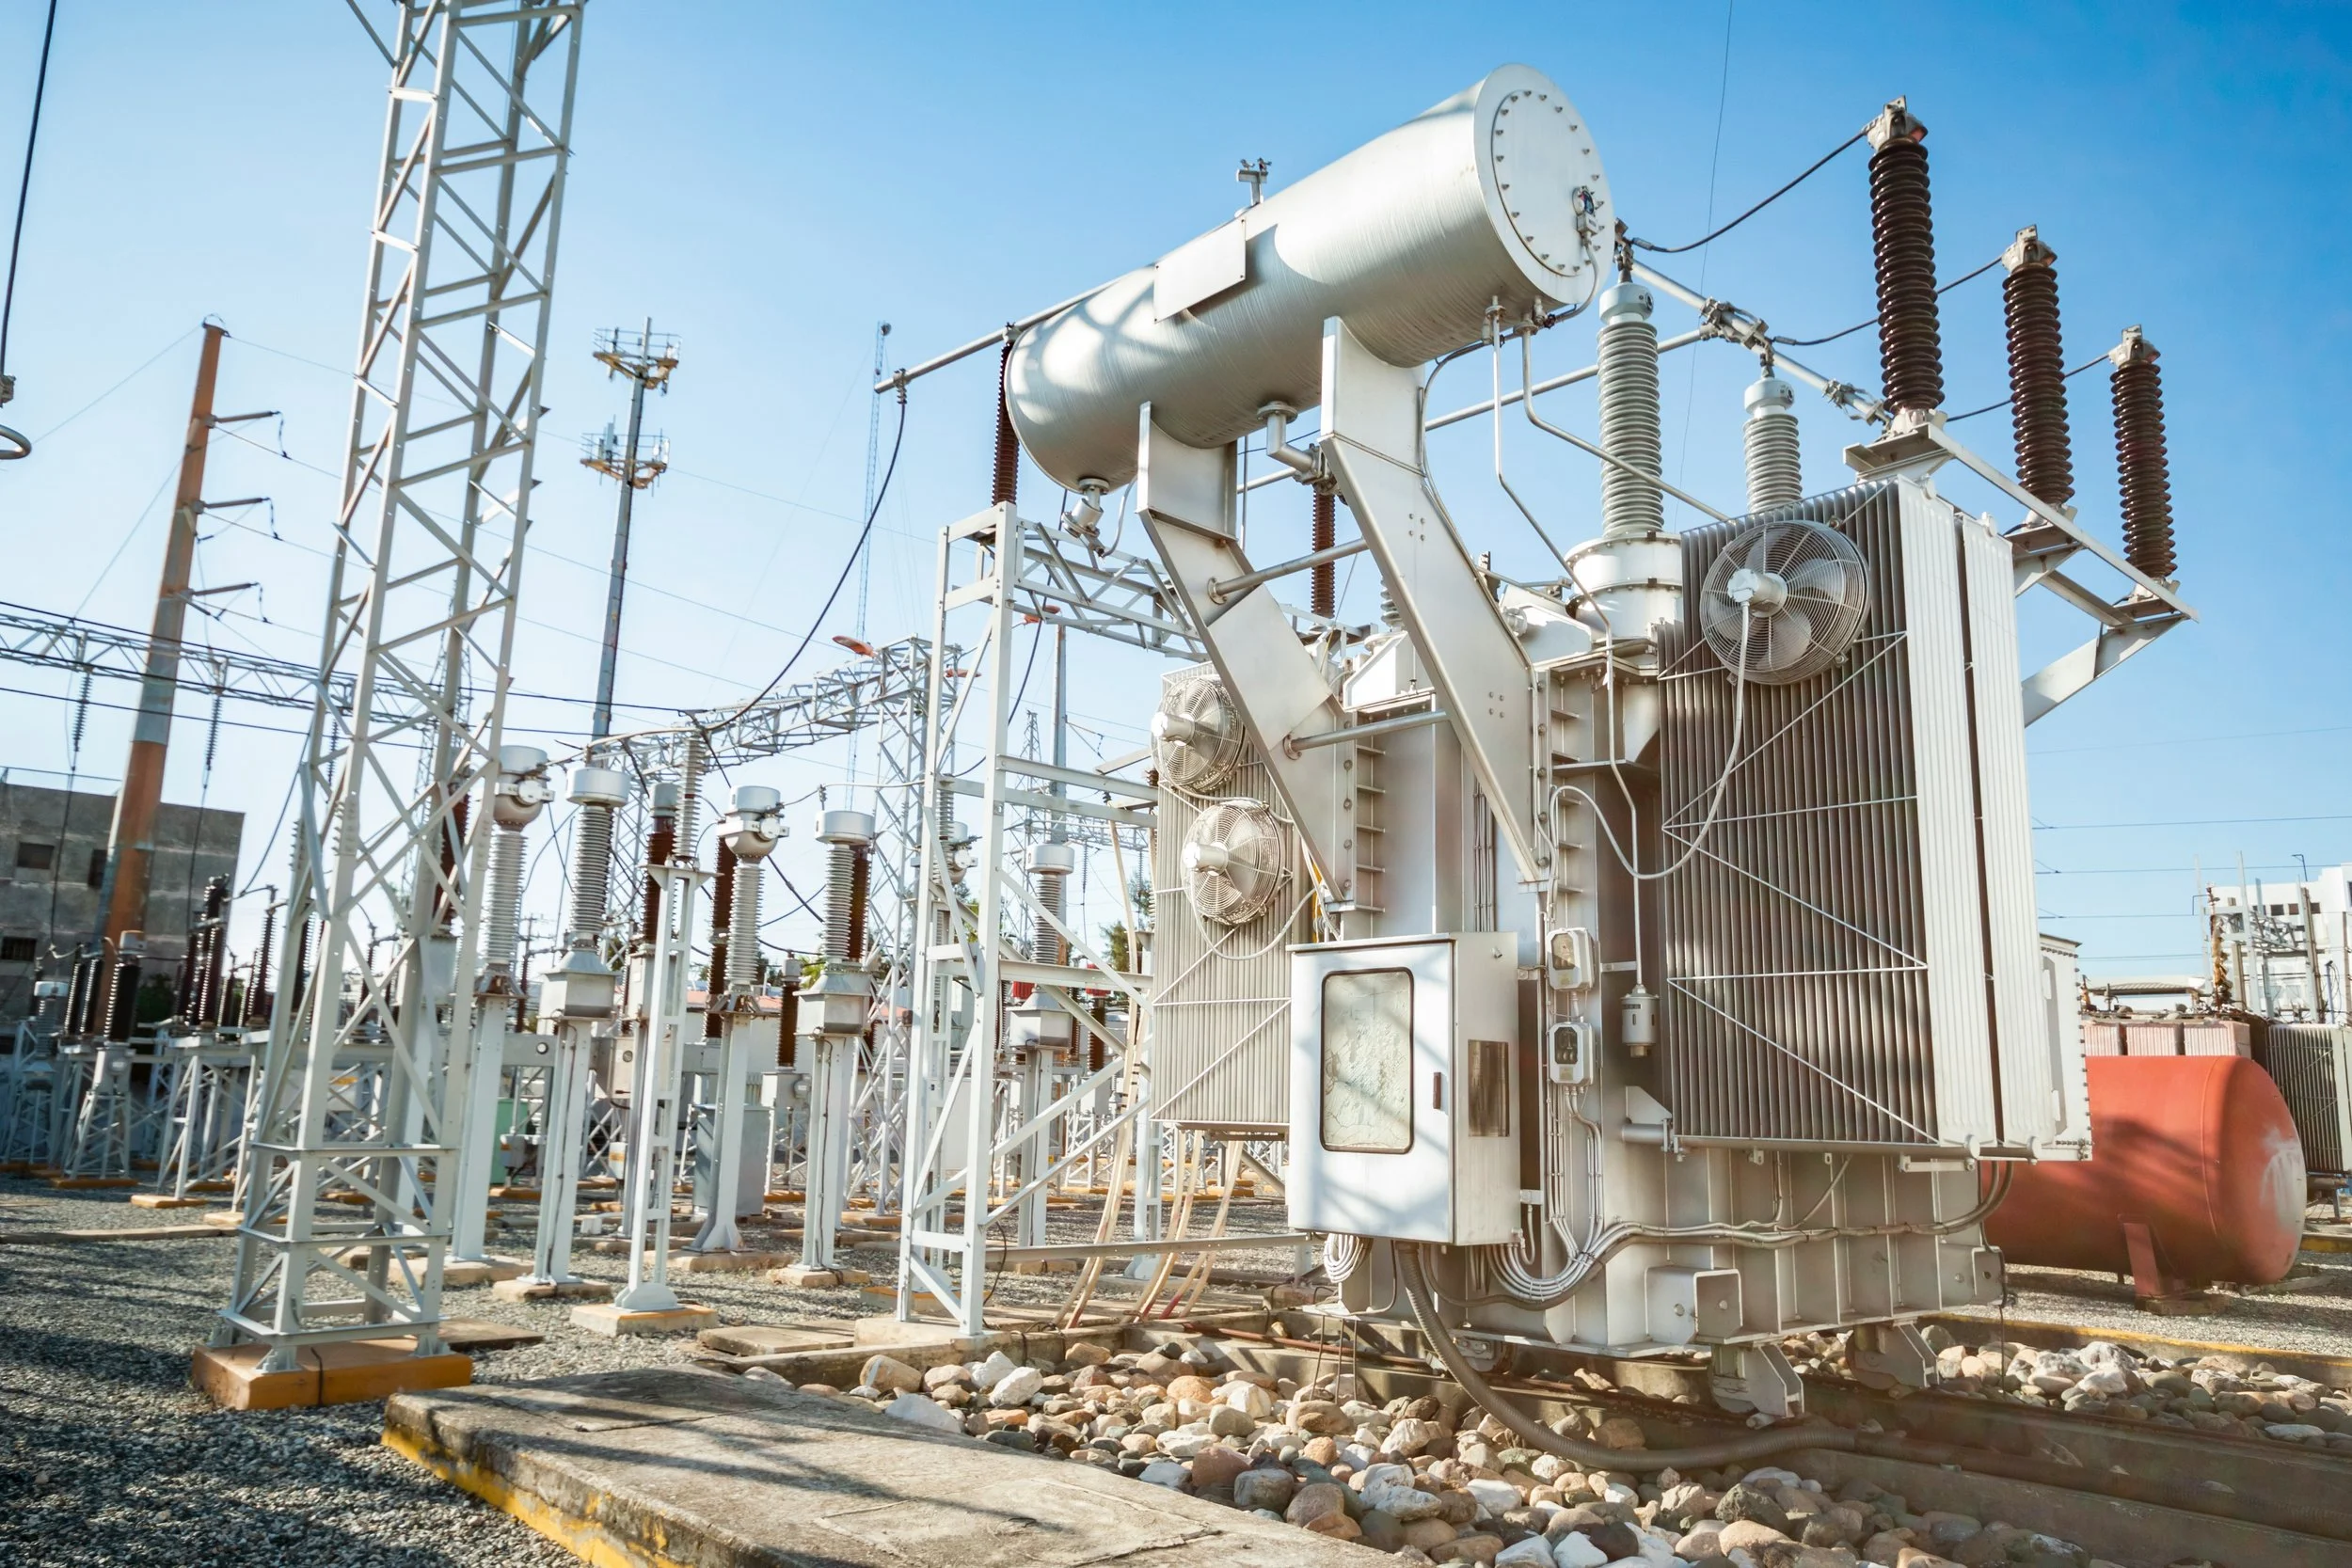
Power and utilities
Examples:
- Renewable generation
- Electricity transmission
- Gas distribution
- Regulated utilities
Characteristics:
- Regulated return models
- Long asset life
- Utility rates often auto-adjust with inflation
Midstream and energy infrastructure

Examples:
- Gas pipelines
- LNG export terminals
- Energy storage
- Refineries
- Petrochemical plant
Characteristics:
- Volume/throughput-based revenue
- Commodity price adjacency
- Long-term contracted
Transportation and logistics

Examples:
- Toll roads
- Airports
- Seaports
- Rail networks
- Shipping
Characteristics:
- GDP-linked volume exposure
- Government concession-based ownership
- Long asset life
Digital infrastructure

Examples:
- Data centers
- Cell towers
- Fiber optic networks
- Wireless spectrum
Characteristics:
- Contracted revenue with tenants
- Capex-intensive
- Shorter asset lives than traditional infrastructure
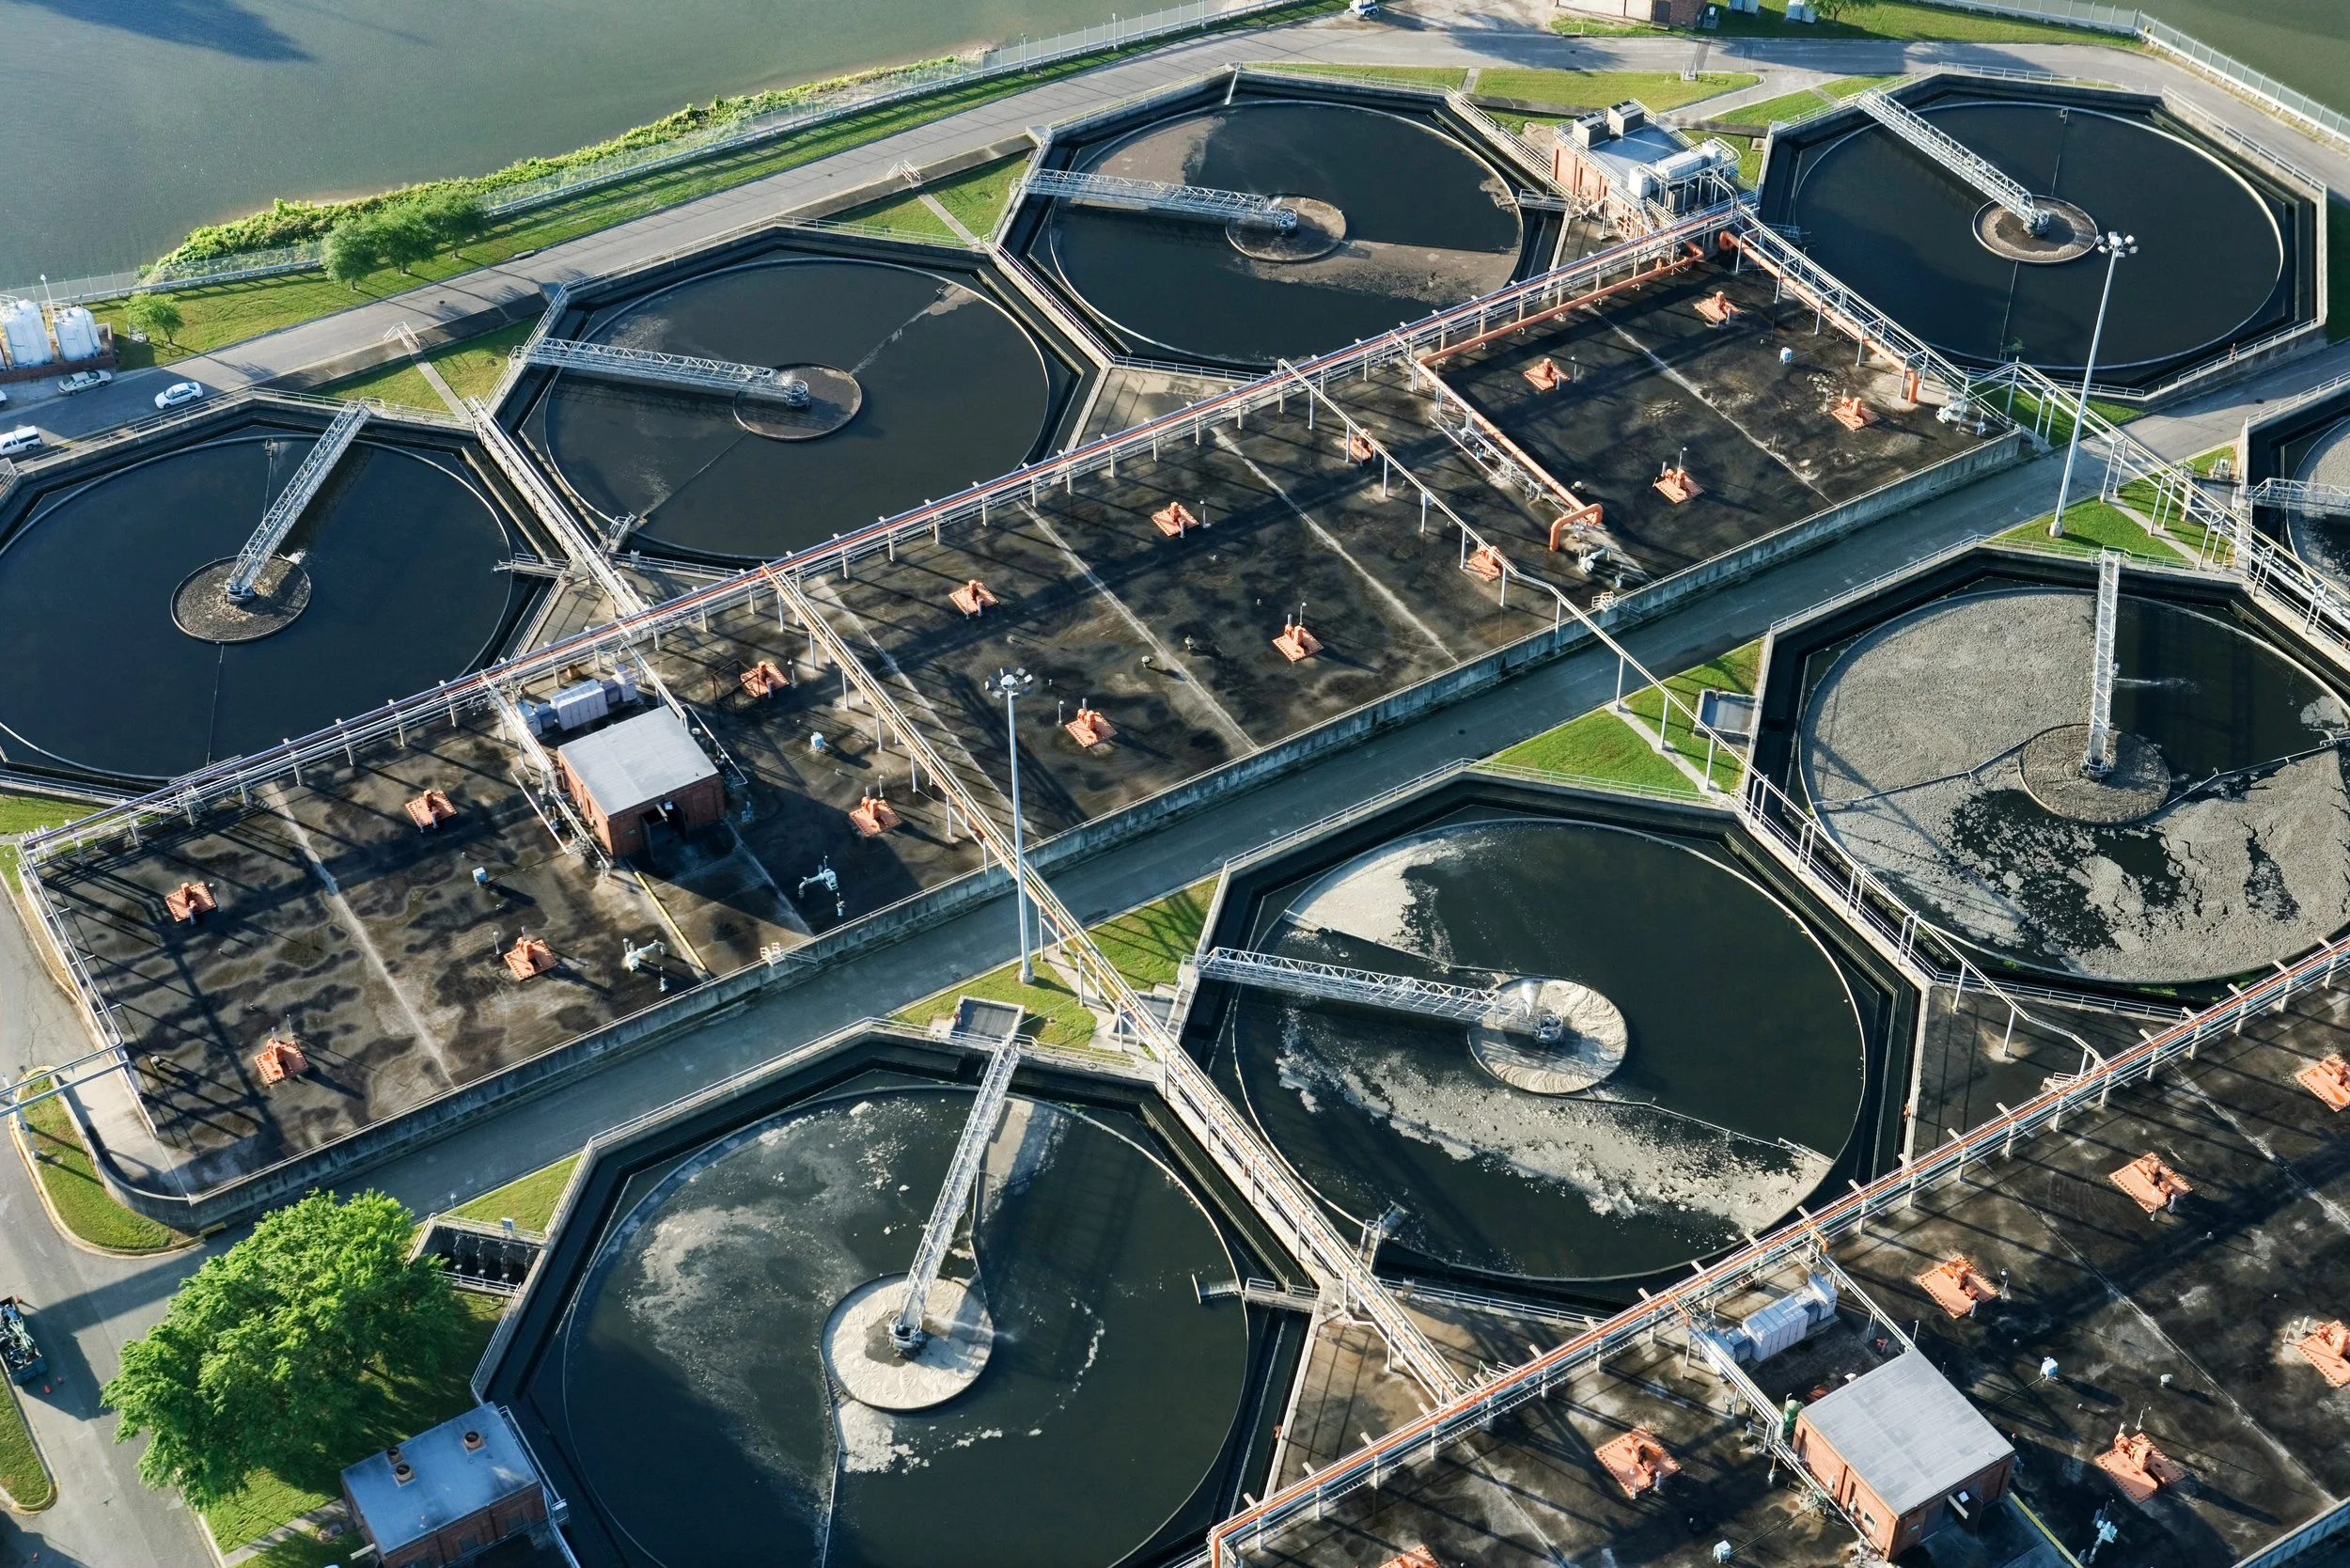
Water and waste
Examples:
- Treatment plants
- Water storage
- Waste-to-energy
- Recycling
Characteristics:
- Heavily regulated
- Government counterparties
- Essential-service demand
Environmental and decarbonization

Examples:
- Carbon capture
- Energy storage
- Energy-from-waste
- Transition-enabling assets
Characteristics:
- Policy-dependent
- Contracted or subsidy-supported revenue
- Earlier stage
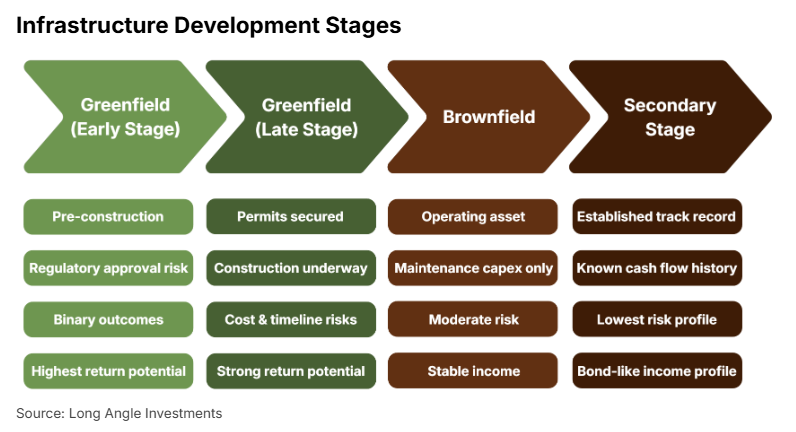
Greenfield (Early Stage)
Early-stage greenfield projects sit at the highest-risk, highest-return end of the infrastructure lifecycle. The asset does not yet exist and regulatory approvals, permits, environmental reviews, and community consents are still being pursued. If any of these fail, committed capital can be substantially or fully lost before construction ever begins, making the risk profile binary. Managers who target this stage are compensated for taking on that development risk with the highest return potential in infrastructure.
Greenfield (Late Stage)
Once permits are secured and construction is underway, the risk profile shifts. The binary regulatory risk is largely resolved and the primary risks become execution-based: cost overruns, timeline slippage, contractor disputes, and supply chain issues. Fixed-price construction contracts, experienced developer partnerships, and staged capital deployment can mitigate but not eliminate these risks. Return potential remains strong at this stage, and investors are still compensated for construction and ramp-up execution risk.
Brownfield
Brownfield refers to existing, operational assets that require upgrades or restructuring, carrying moderate risk. These assets typically have clear potential for expansion, improvement, or repositioning through active management. So the risks shift from construction to market and execution. Cash flows are generally predictable because they're tied to established contracts or regulatory frameworks, and growth capex may be deployed to add capacity, upgrade technology, or expand into adjacent markets.
Secondary Stage
Secondary-stage refers to stable and mature assets, with multi-year operating track records and predictable cash flows. These assets require no investment for development. Risk is at its lowest point in the lifecycle, and returns come primarily from durable, contracted, or regulated income streams rather than capital appreciation. This is why infrastructure at this stage is often characterized as "bond-like": steady, contracted income with modest capital growth.
Infrastructure Investment Strategies
The asset class can be divided into five strategies: core, core-plus, value-add, opportunistic, and infrastructure debt. Each has a distinct risk profile and return target. While core and core-plus focus on more mature assets with less risk, value-add and opportunistic target greenfield and brownfield assets with higher upside but greater risk of loss.
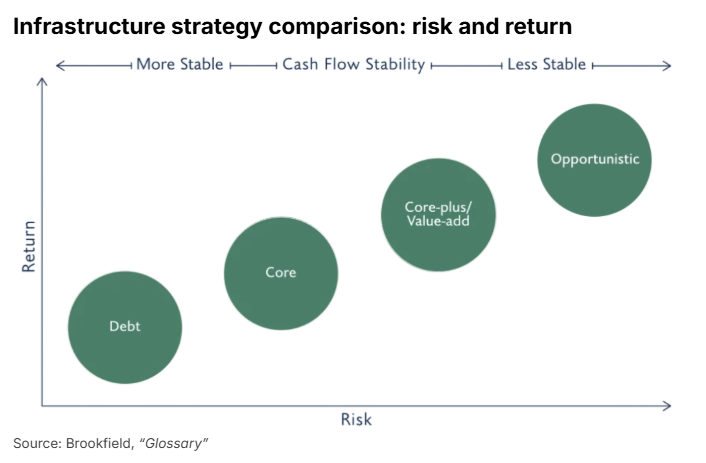
Infrastructure Strategies: Risk, Target Returns, and Descriptions
Sources: Long Angle Investments. Target net IRR ranges reflect Long Angle's synthesis of manager targets across our diligence process, cross-referenced against published ranges from Cambridge Associates.
When comparing infrastructure fundraising dollars from 2020 to 2025, value-add was the fastest-growing strategy. Core fundraising contracted from 2024 to 2025, reflecting LP demand for higher returns.
The definition of core-plus has broadened in recent years. Infrastructure managers may apply the label to "infrastructure-adjacent" or "essential services" businesses, including logistics platforms, healthcare facility management, environmental services, education services, and digital connectivity businesses that exhibit infrastructure-like resilience without being traditional hard assets.
Revenue Frameworks
There are four frameworks for how an infrastructure asset generates revenue:
Availability-based: fixed payment from a government or public body regardless of usage. This type of revenue is common for social infrastructure and some transportation assets. While demand risk is removed, returns are often capped by concession contract. Availability-based revenue is bond-like, immune to recession, but has a ceiling on upside.
Regulated: returns set or bounded by a regulatory framework, typical for utilities and water companies. The revenue is predictable and stable through cycles but is subject to periodic rate reviews, sensitive to regulatory action, and inflation-linked in most jurisdictions.
Contracted: long-term offtake agreements with creditworthy counterparties. This category includes power purchase agreements, pipeline transport agreements, and data center leases. Revenue is predictable during the contract term, but subject to refinancing and renewal risk when contracts expire. Contracted revenue is also susceptible to counterparty risk.
GDP-linked / merchant: revenue tied to market prices or usage volumes. Assets include toll roads, airports, and some energy assets. The category participates in economic growth with high upside, but is exposed to downturns and volatility of cash flows.
Infrastructure Fund Size
Mega-funds and large-cap managers compete primarily in auction processes for well-known, trophy assets. These funds offer scale, diversification within a single vehicle, and access to marquee assets like major airports, national utilities, and hyperscaler data centers. However, auction dynamics can inflate entry multiples and compress returns.
Mid-market managers compete in a less crowded space. Auction competition is lower, and a larger share of transactions happen outside of formal sales processes. Entry multiples tend to be lower, and there is generally more opportunity for operational value creation and platform building (see Infrastructure Return Drivers section below) since assets are often earlier in their institutional ownership lifecycle. Mid-market depends more heavily on manager execution than large-cap.
Why Invest in Infrastructure?
At the most basic level, infrastructure is often grouped with income-focused asset classes like private credit and real estate. They all offer meaningful yield, some level of inflation protection, and lower correlation to public markets than private equity. Infrastructure stands out because it covers a wider range of the income vs. capital appreciation spectrum. Core is generally income-focused, core-plus is more balanced, and value-add and opportunistic shift toward capital appreciation.
Infrastructure also has unique attributes and portfolio-level benefits that distinguish it from other private asset classes.
Unique Attributes of Infrastructure
Demand inelasticity
Infrastructure provides essential services with few substitutes. Usage stays remarkably steady across economic cycles because people still commute, consume electricity, stream data, and ship goods during recessions.
High barriers to entry
Regulatory approvals, physical constraints, and the capital required to build competing assets create durable monopoly or duopoly positions. Once a data center campus is operating or a pipeline is in the ground, competition can be limited.
Predictable long-term cash flows
Infrastructure revenues typically come from long-term contracts, regulatory frameworks, or concession agreements that lock in pricing and volumes for years or decades. This structure provides visibility into future cash flows that few other private markets categories can match.
Built-in inflation protection
Most long-term contracts include CPI escalators that adjust prices upward as inflation rises. Assets without explicit indexation still tend to have pricing power derived from their monopolistic position (a regulated utility or a critical pipeline can pass rising costs through to end users). This gives infrastructure a real inflation hedge built into the underwriting.
Portfolio-Level Benefits of Infrastructure
Low correlation to public markets
According to J.P. Morgan Asset Management, infrastructure has a correlation to a traditional 60/40 portfolio under 0.2, on a scale where 1.0 means perfectly synchronized and 0 means independent. This means infrastructure moves largely on its own economic drivers rather than in step with public equities and bonds.
Attractive risk-adjusted returns
Infrastructure generates returns efficiently relative to the risk taken. A useful way to measure this is the Sharpe ratio, which quantifies how much excess return an investment generates per unit of risk. Risk in this context is the volatility of returns over time. A Sharpe ratio above 1.0 is considered strong and above 1.5 exceptional.
Private infrastructure has a 10-year Sharpe ratio of 1.57, well above the next-best major asset class (private credit at 0.92) and nearly double the S&P 500 at 0.82 (see chart below titled 10-Year asset class performance). Few alternatives deliver competitive absolute returns with the low volatility that infrastructure has historically shown.
Downside protection during equity drawdowns
During the ten worst quarters for equities between 2013 through H1 2023, private infrastructure delivered positive returns while equities and fixed income both declined. During recessions, underlying infrastructure cash flows still hold up due to the demand inelasticity discussed above.
Infrastructure Market Tailwinds
Infrastructure managers commonly frame the secular case for the asset class around the "three Ds":
Digitization
The buildout of digital infrastructure to support the accelerating growth of data creation, cloud computing, and artificial intelligence. Data centers, fiber networks, cell towers, and wireless spectrum are experiencing sustained capital investment at an unprecedented scale.
Decarbonization
The multi-decade energy transition away from fossil fuels towards lower-carbon sources. Electrification, renewable generation, grid modernization, storage, and low-carbon fuels are all capital-intensive investments that will continue across geographies.
Deglobalization
The reshoring of critical supply chains, energy security investment, and the buildout of domestic manufacturing capacity. Semiconductor fabs, EV battery plants, LNG export terminals all fall in this category. As global trade patterns fragment, new physical infrastructure will be needed to support the shift toward regional supply chains.
Demographics
Demographic shifts are often considered the fourth "D" impacting infrastructure markets, which include population growth, urbanization, and aging populations. These shifts drive demand for transportation, logistics, water, and social infrastructure.
Underlying the tailwinds is the public funding gap. G20 nations face a multi-trillion-dollar shortfall between infrastructure needs and government funding. In the US, the ten year funding gap across water, roads, power, transit, and airports approaches $8 trillion, with roughly half of that unfunded by planned public investment as of 2024. Private capital is increasingly stepping in to fill the gap.
Historical Performance
Income and Capital Appreciation
Infrastructure returns come from two components: income distributions (contracted or regulated cash flows paid out to investors) and capital appreciation (changes in the underlying value of the assets). The chart below shows 16 years of global infrastructure returns broken down by these two components on a rolling four-quarter basis.
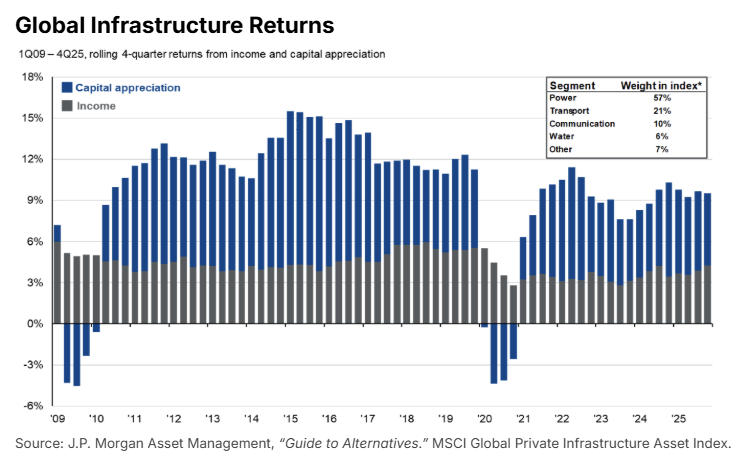
The income component (the grey bars) has been remarkably stable across the entire period, ranging between roughly 3–6% annually regardless of market conditions. Investors received consistent cash distributions through the 2009 aftermath of the GFC, the 2020 pandemic, the 2022 inflation shock, and the 2023 banking stresses. Capital appreciation (the blue bars) contributes the remainder of total return but is more variable, with occasional periods of negative performance during downturns. Since 2021, appreciation has added between 3–7 percentage points on top of the stable income base. This composition is why infrastructure can stabilize portfolios across cycles while still offering upside.
Long-Term Return Profile
The chart below compares 10-year annualized returns across major asset classes ending September 2025. Private infrastructure has delivered roughly 9% annualized over the past decade, trailing only large-cap US public equities and private equity. Infrastructure has outpaced international equities, small-cap equities, hedge funds, REITs, and private real estate.
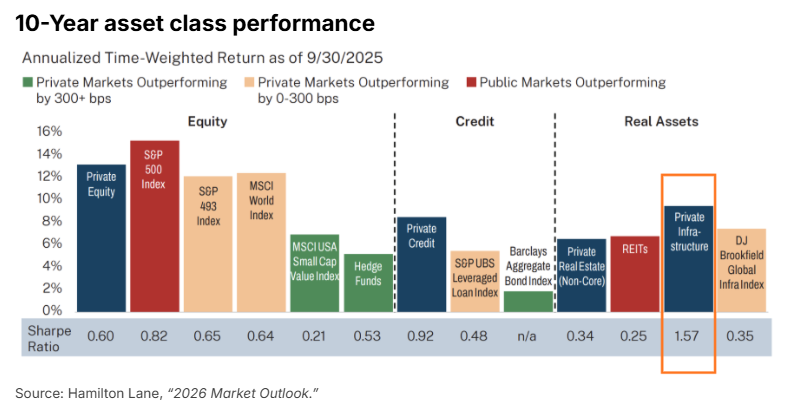
Looking ahead, KKR projects non-core private infrastructure to deliver the second-highest annualized returns of any asset class over the next 10 years, at 10.4%. That outpaces large-cap public equities by roughly 5 percentage points and sits just behind private equity at 11.6%.
Infrastructure Return Drivers
The best managers create value to drive returns above what asset ownership alone would deliver.
Operational value creation
- Revenue growth from contracted volume or pricing escalators.
- Margin expansion as operating assets ramp toward full capacity.
- Multiple expansion in higher-growth sub-sectors.
Unlike private equity, infrastructure value creation is primarily driven by top-line revenue growth rather than multiple expansion or leverage.
Platform building
Beyond operating the assets they own, infrastructure managers actively build platforms: acquiring an initial asset or company and then growing it through bolt-on acquisitions and organic expansion into a larger, more valuable business. Platform building creates value in three ways:
- Multiple arbitrage, since smaller assets can be acquired at lower multiples and the combined platform sells at scale multiples.
- Operational synergies across the bolted-on assets.
- Expanded market position that comes with scale.
Platform building is most common in fragmented sectors where roll-up economics are attractive. These include fiber networks, data centers, waste management, midstream energy, and renewable development. A variant of platform building is to commit capital to an operational management team that then sources, develops, or acquires assets to build a platform from scratch (known as "back-and-build").
Capital recycling
Infrastructure managers recycle capital by selling stabilized mature assets (often to pension funds or core buyers seeking lower-risk cash flows) and redeploying proceeds into higher-returning development or value-add opportunities. This accelerates distributions ahead of fund end and improves the fund's forward return potential.
Risks and Considerations
Regulatory risk
Infrastructure assets are highly regulated. Changes in regulation, rate reviews, environmental requirements, or concession renegotiations can impact returns.
Political and headline exposure
Critical infrastructure attracts public and political scrutiny. Privatized assets that raise prices or underperform service standards could face adverse press or legislative pressure.
Counterparty risk
Long-term contracts introduce the risk that the counterparty fails to perform. Concentration in one or a small number of customers amplifies the exposure.
Leverage risk
High leverage is common and often attractive given stable cash flows, but it amplifies downside when revenues miss, particularly for assets with merchant or volume exposure.
Emerging markets
Emerging markets infrastructure offers higher return potential, but comes with elevated political, regulatory, currency, and counterparty risk.
Illiquidity
Long hold periods, typically 10–15 years for closed-end core and value-add funds, with open-ended/perpetual even longer. Opportunistic funds typically run 8–12 years. Capital is called over years, distributions can be delayed, and the secondary market for infrastructure is immature.
Fees
Fee loads (management fees, carried interest, deal fees, monitoring fees) compound significantly over long fund lives. Net-of-fee returns are the only returns that matter.
Manager dispersion
The gap between top-quartile and bottom-quartile infrastructure managers is significant, just as it is for all private asset classes. Manager selection is critical.
Tax treatment
Infrastructure investments carry several tax advantages. Assets often generate depreciation deductions that offset current taxable income, shielding cash distributions and deferring taxation until depreciation is exhausted or the asset is sold. Asset appreciation qualifies for long-term capital gains treatment if held for over one year. Energy projects may be eligible for Investment Tax Credits and Production Tax Credits.
How to Evaluate Infrastructure Managers
Regulatory and government relationships
Infrastructure operates within regulatory frameworks and concession structures. Evaluate a manager's relationships with regulators, permitting authorities, and concession-granting bodies in the jurisdictions they invest in. This especially matters in emerging markets and in regulated sectors like energy and utilities where permitting decisions can shape returns.
Operational and platform-building capability
Infrastructure assets require active operational management. Evaluate a manager's in-house operating talent and track record of executing complex capex programs, bolt-on acquisitions, and platform buildouts. Has the manager grown a portfolio company from a single asset into a multi-asset platform through disciplined M&A and organic expansion?
Infrastructure projects often involve multi-billion-dollar capex commitments financed through large syndicated debt facilities. What is the team's project finance experience and relationships with major infrastructure lenders?
Sector expertise and technical underwriting
Evaluate a manager's operating expertise in the sectors they underwrite. For example, renewable energy, digital infrastructure, midstream, and transportation each have distinct technical, regulatory, and commercial dynamics.
Private markets diligence
As with any alternative asset class, standard evaluation criteria apply:
- Manager track record should show consistency across vintages and alignment with the stated strategy, with realized exits and mark-to-realization figures.
- GP commitment should be meaningful in absolute dollars and consistent across prior funds.
- Fees: carried interest structure (hurdle rate, catch-up, clawback provisions) matters over long fund lives. Total fee load, including management fees, deal fees, and monitoring fees, compounds over time.
- Risk management practices and underwriting discipline should be examined alongside the historical handling of underperforming assets.
Final Thoughts
Reach out to the Long Angle Investments team with any questions on private infrastructure and opportunities to invest.
Frequently Asked Questions
What Is the Difference Between Core and Core-Plus Infrastructure Investing?
Core infrastructure targets secondary-stage monopoly assets in transparent regulatory environments, producing stable contractual cash flows with a risk/return profile that resembles a bond. Target net IRR is 6–8%. Core-plus leans toward brownfield assets with some demand sensitivity or modest growth capex, retains the same defensive fundamentals, and targets 8–10% net IRR.
What Is Greenfield Infrastructure and How Does It Differ from Brownfield?
Greenfield infrastructure refers to assets that do not yet exist. Early-stage greenfield carries binary regulatory risk before permits are secured; late-stage greenfield has permits and is under construction, with primary risks shifting to cost overruns and timeline slippage. Brownfield refers to existing, operational assets requiring upgrades or repositioning, carrying moderate risk with predictable cash flows tied to established contracts or regulatory frameworks.
How Does Private Infrastructure Perform Compared to Private Equity and Private Credit?
Private infrastructure produced roughly 9% annualized over the past decade, trailing only large-cap US public equities and private equity. Its 10-year Sharpe ratio of 1.57 is nearly double the S&P 500 at 0.82 and well above private credit at 0.92. KKR projects non-core private infrastructure to deliver 10.4% annualized over the next 10 years, just behind private equity at 11.6%.
Does Private Infrastructure Protect Against Inflation?
Most long-term infrastructure contracts include CPI escalators that adjust prices upward as inflation rises. Assets without explicit indexation tend to have pricing power derived from their monopolistic position: a regulated utility or a critical pipeline can pass rising costs through to end users. This gives infrastructure a real inflation hedge built into the underwriting.
What Are the Main Risks of Private Infrastructure Investing?
Key risks include regulatory risk (changes in rate reviews or concession renegotiations), political and headline exposure, counterparty risk in long-term contracts, leverage risk that amplifies downside when revenues miss, illiquidity with hold periods typically 10–15 years for closed-end funds, fee loads that compound over long fund lives, and significant manager dispersion between top-quartile and bottom-quartile managers.
How Do Infrastructure Managers Generate Returns Beyond Owning Assets?
The best managers create value through operational value creation (revenue growth, margin expansion, multiple expansion), platform building (acquiring assets and growing them through bolt-on acquisitions for multiple arbitrage and operational synergies), and capital recycling (selling stabilized mature assets and redeploying proceeds into higher-returning development or value-add opportunities).
What Fees Should Investors Expect in a Private Infrastructure Fund?
Fee loads in private infrastructure include management fees, carried interest, deal fees, and monitoring fees. These compound significantly over long fund lives. Net-of-fee returns are the only returns that matter when evaluating manager performance. The carried interest structure (hurdle rate, catch-up, and clawback provisions) deserves particular scrutiny given infrastructure's long hold periods.
What Should I Look for When Evaluating an Infrastructure Fund Manager?
Evaluate regulatory and government relationships in relevant jurisdictions, operational and platform-building capability (in-house operating talent, complex capex execution, bolt-on M&A track record), sector expertise and technical underwriting specific to the sectors targeted, and standard private markets diligence criteria: track record consistency across vintages, GP commitment, total fee load, and risk management practices.
Most financial decisions at this stage are made without anyone to compare notes with.
Long Angle is a vetted community of 8,000+ founders, executives, and investors who discuss private markets allocations, manager relationships, tax strategy, and the full complexity of wealth at this stage, with their real names attached and no one in the room trying to sell them anything.
Alternative investments